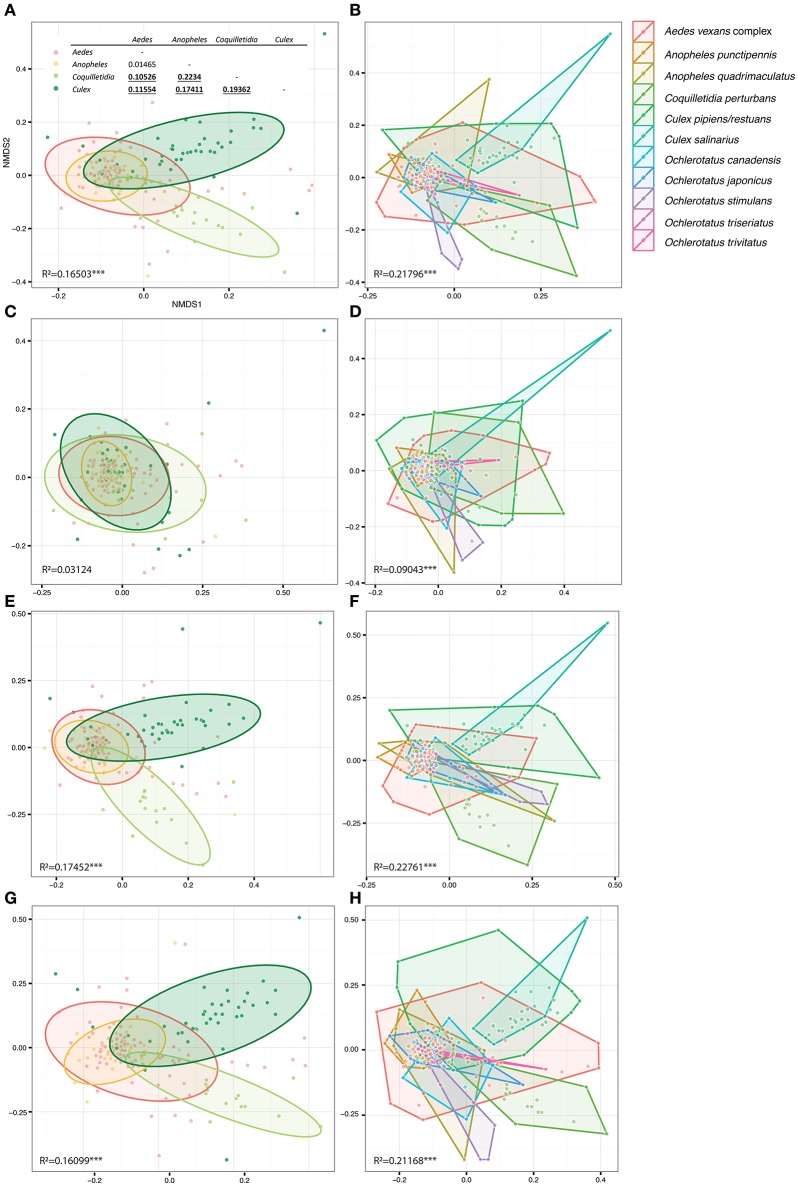
Figure 5.
Overall differences among microbiomes of different mosquito genera (right) and species (left) plotted in constrained ordinations. (A,B) were produced using the complete single mosquito dataset; (C,D) are based on data from which all Wolbachia OTUs were removed in order to test Wolbachia effects on dissimilarity among microbiota profiles (for more details see Materials and Methods). (E,F) present control analyses excluding the next most abundant OTU, i.e., Asaia (E,F), from the data set, and an OTU shared by all the mosquito taxa, i.e., Pseudomonas (G,H). (A) includes pairwise statistical evaluation: bold underlined numbers stand for R2-values significant at 99% confidence interval calculated for dissimilarities of genera pairs. R2−values indicate statistical evaluation of dissimilarities among all genera/species in each plot. Considering the low number of samples per species, hulls were used to highlight the corresponding points, instead of the statistical ellipses used for genera based analyses.

