Figure 1.
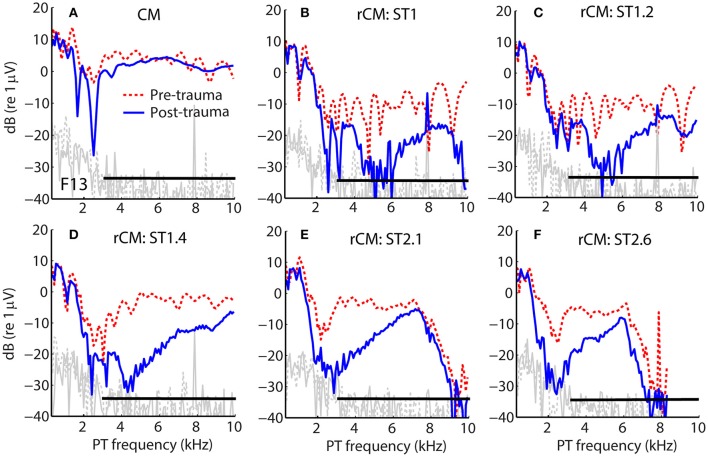
Example of CM (A) and rCM (B–F) levels measured in a chinchilla before (dashed red) and after (solid blue) inducing an acoustic trauma. The black horizontal bar marks the frequency range with CAP sensitivity loss > 20 dB (3–11 kHz, with maximal shift at 6.3 kHz of 32 dB; also see Figure 2B). Noise floors are shown in gray.

