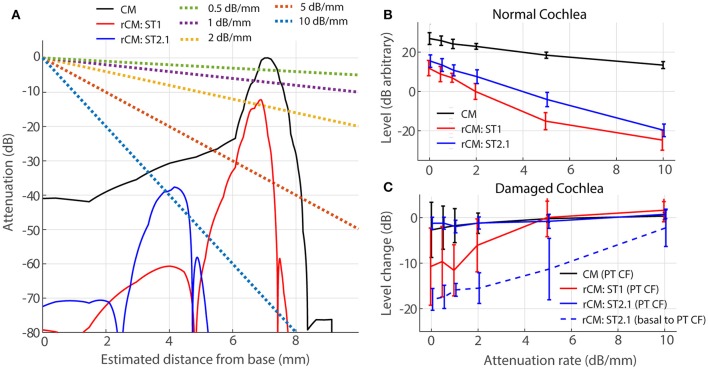
Figure 7.
Effects of electrical attenuation on modeled CM and rCM for a PT frequncy of 4 kHz. Panel (A) shows attenuation functions w(x) for different attenuation rates (A, see the legend) using dashed lines, together with examples of spatial distrubutions of CM and rCM sources scaled re CM source strength at the CF place of the PT (solid lines; phase is not shown). The spatial source distributions were computed for normal-gain conditions based on the BM displacement shown in Figure 4. Panel (B) shows average levels (± 1SD; n = 4,) of CM and rCM for varying attenuation constants (x-axis). In (C) the change in CM and rCM levels due to gain reduction either at the CF place of the PT (solid) or basal to it (dashed; CM, and rCMST1 are not shown here, as neither is affected by basal damage; Figure 6, red squares).

