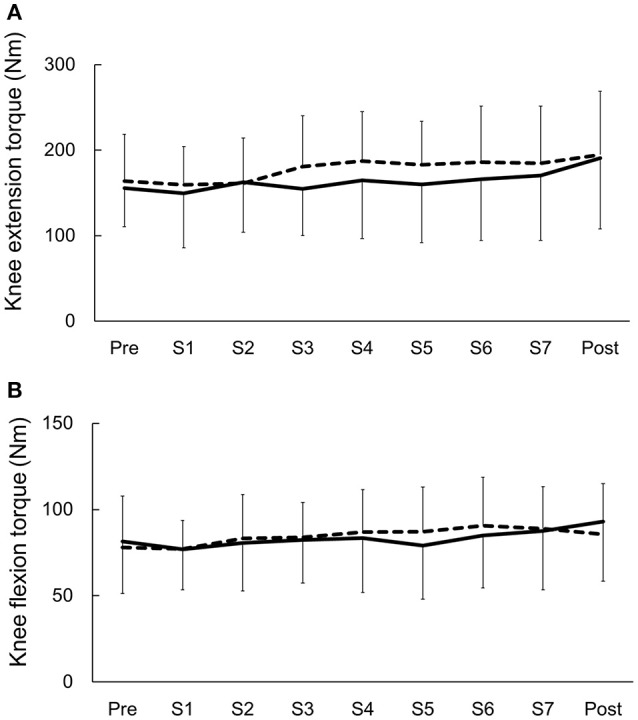
Figure 4.

Changes in knee torque before (Pre) and after (Post), and throughout the training sessions. Data are presented as the mean ± standard deviation. Solid lines represent the anodal transcranial direct current stimulation (tDCS) group. Dashed line represents the sham tDCS group. (A) Effects of anodal tDCS (real and sham) combined with muscle strength training on knee extensor torque. (B) Effects of anodal tDCS (real and sham) combined with muscle strength training on knee flexor torque.
