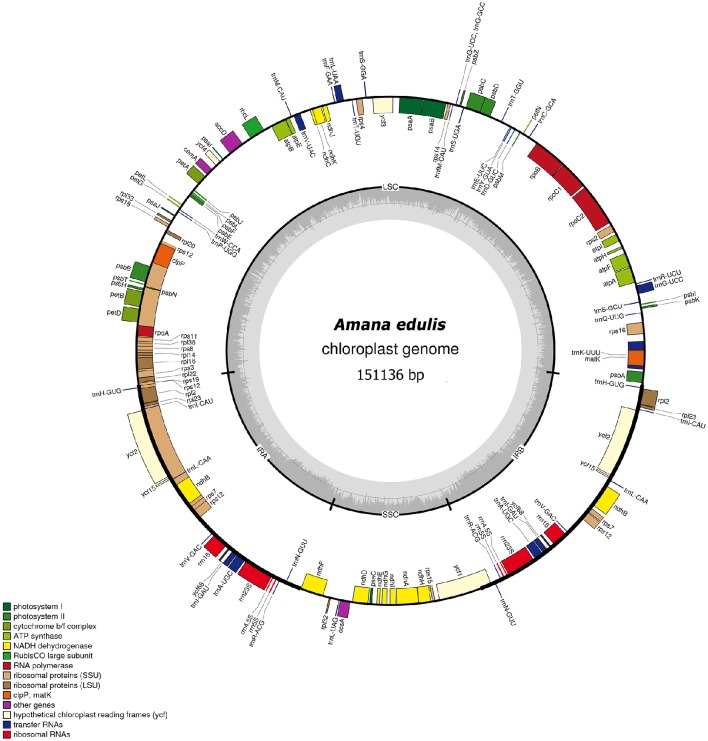
Figure 2.
Gene map of the Amana edulis chloroplast genome. Genes shown on the outside of the circle are transcribed clockwise, and genes inside are transcribed counter-clockwise. Genes belonging to different functional groups are color-coded. The darker gray in the inner corresponds to the GC content, and the lighter gray to the AT content. The cp genomes of other five Amana species are slightly different with that of A. edulis in nucleotide composition, but do not vary in terms of gene content or order.

