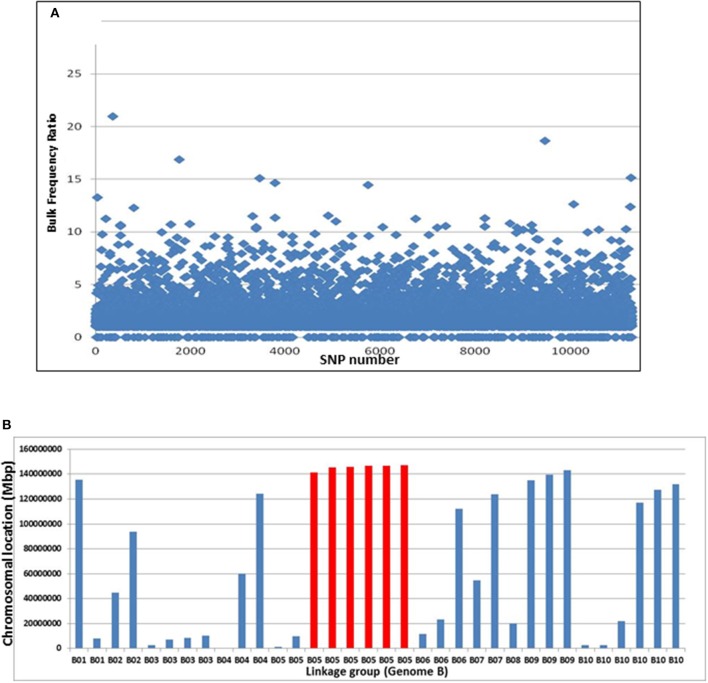
Figure 3.
Bulk frequency ratio (BFR) analysis to identify SNPs and genome locations that are linked to Bunch1. (A) The distribution of BFR in ~13,000 varietal-specific SNPs. (B) The genomic locations of the 34 SNPs with the highest BFR (>10), indicating one over-represented region at the end of linkage group 5B (red).

