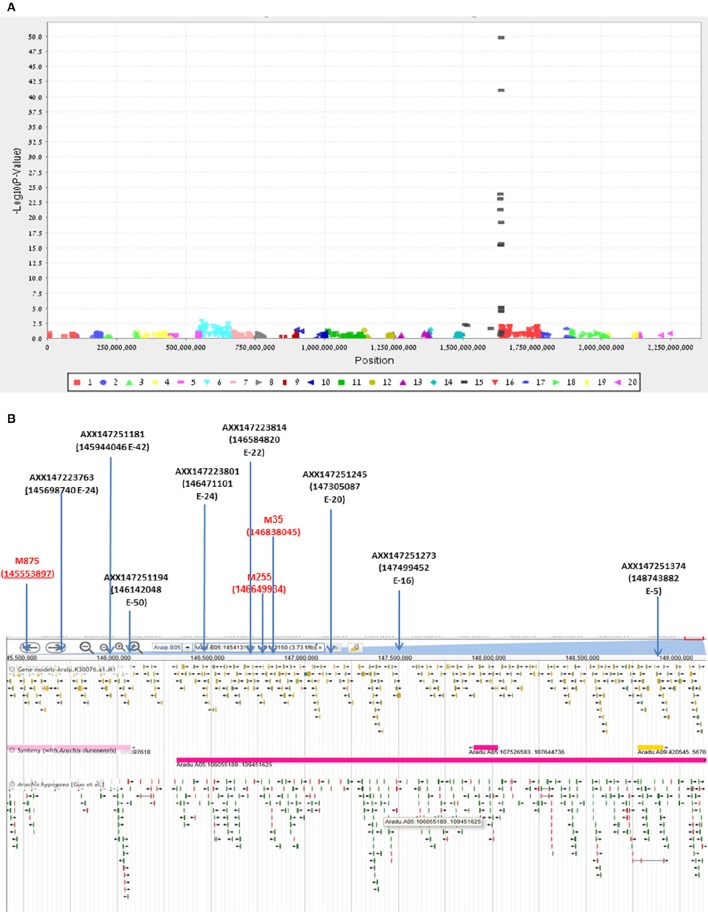
Figure 5.
Validation and further fine-mapping of Bunch1 using an Affymetrix Axiom SNP array. (A) Manhattan plot for the analysis of linkage between 615 Affymetrix Axiom SNPs and the Bunch1 phenotype. 1–10 = genome A; 11–20 = genome B (e.g., 15 = linkage group 5B). (B) Integrative map for the bulk segregant analysis and SNP-array analyses of the peanut linkage group B5 (from PeanutBase.org). Markers derived from the bulk segregant analysis are indicated in red. Yellow–gene models. Green–ESTs of genes. Pink–syntheny of this region with A. duranensis (Genome A).

