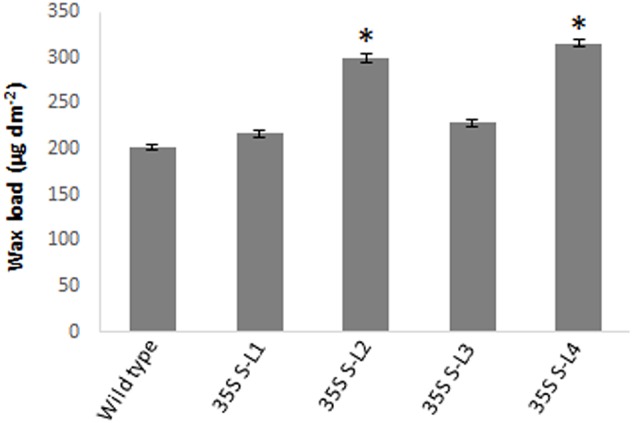
FIGURE 3.

Estimation of total surface wax load from leaves of 4 months old transgenic and wild type mulberry plants grown under normal conditions. Error bars indicate ±SE and statistical significance were shown with asterisk (P < 0.05). 35S S-L1, L2, L3, and L4 are different transgenic lines.
