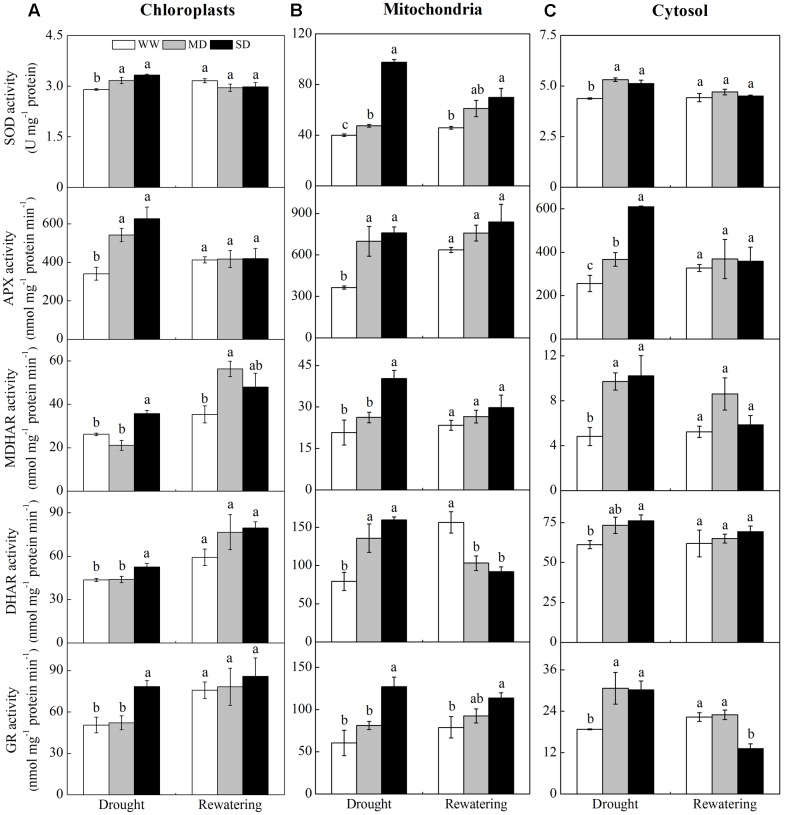
FIGURE 4.
Changes in the activities of antioxidative enzymes in chloroplasts (A), mitochondria (B), and cytosol (C) from F. rufa leaves under drought and rewatering. Well-watered (WW, open bars), moderate drought (MD, gray bars), and severe drought (SD, closed bars). Data are the means of four replicates with SE shown by vertical bars. Different letters within the same stage indicate significant differences (P < 0.05) according to Duncan’s test.

