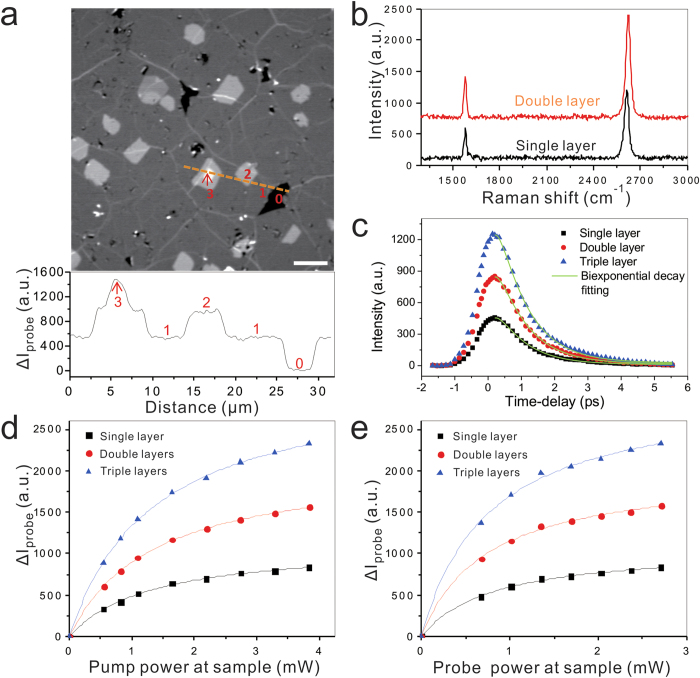
Figure 1. TA imaging of graphene on glass coverslip.
(a) TA image of graphene layer (upper) and intensity profile along the dashed line (lower). Single layer (position 1) graphene can be easily distinguished from defects (position 0), double layers (position 2) and multiple layers (position 3). The pump beam was at 665 nm, and probe was at 820 nm. Scale bar: 10 μm. (b) Raman spectra of graphene sheet with different layer number. (c) Time-delay curve of TA imaging on single, double and triple graphene layers. Time zero was determined by stimulated Raman scattering (SRS) image. The data points were fitted with a two component exponential model (Green line) (d,e) Dependence of TA imaging on pump (d) and probe (e) power. Pump and Probe beam power was fixed at 1.10 mW and 0.68 mW at sample, respectively, when the other beam is tuned from 0 to 5 mW. Data were fitted with the saturation function y = Ax/(1+x/xs). Here, A is a constant, x is the input power, and xs represents the saturation power.

