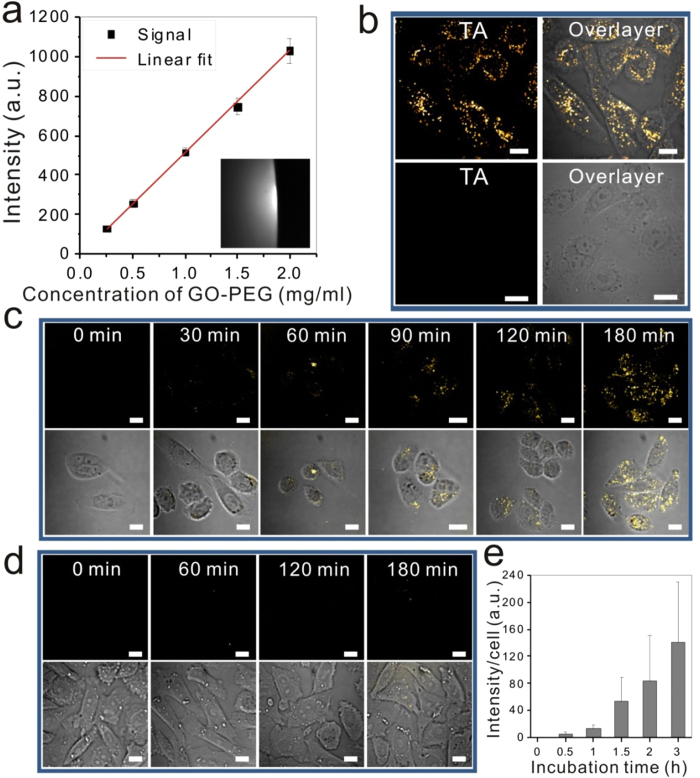
Figure 3. TA imaging of GO-PEG in solutions and in living cells.
(a) TA imaging of 2 mg/ml GO-PEG aqueous solution (inset) and linear dependence of TA signal on GO-PEG solution concentration. (b) TA imaging of GO-PEG in living CHO cells. CHO cells were treated with 10 μg/ml GO-PEG (upper) or PEG (lower) for 3 h. Overlay of TA image (yellow dots) and transmission image (gray) showed intracellular GO-PEG in GO-PEG treated cells, but not in PEG only treated cells. Dynamic cellular uptake of GO-PEG (c) or PEG (d) was monitored by TA imaging overtime, from 0 to 180 min after treatment. TA images (first row) and overlay images (second row) showed intracellular accumulation of GO-PEG. (e) Quantification of mean TA signal intensity per cell in GO-PEG treated cells. Scale bar: 10 μm.

