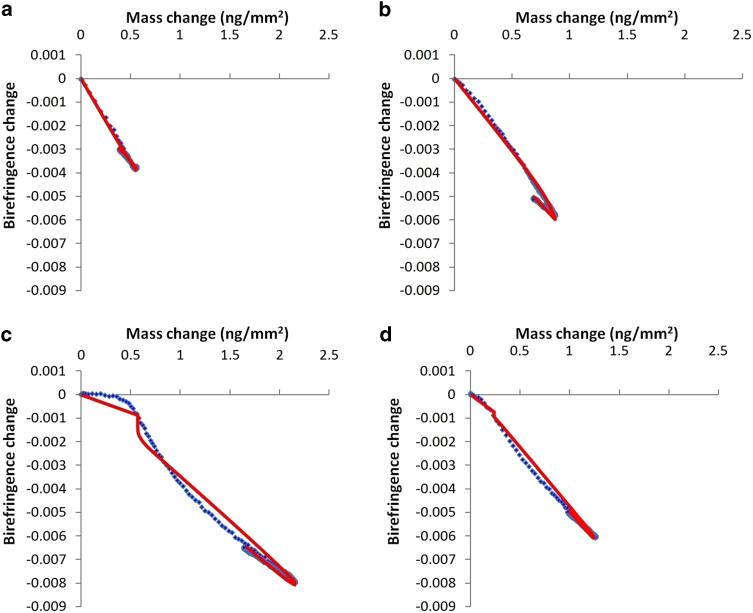
Figure 3.
Plots of birefringence vs. mass for the experimental data and a selected model for AT1R-H8 binding to various lipid bilayers. The model selected gives the best balance between a good fit and avoiding excessive parameters that only marginally improve the fit. (A): experimental data for Helix 8 binding to DMPC (blue dots), with the three-state model with bilayer expansion fitted to the data (red line). (B): experimental data for Helix 8 binding to DMPC/DMPS (blue line), with the two-state model fitted to the data (red line). (C): experimental data for Helix 8 binding to DMPC/DMPS/PI(4)P (blue line), with the three-state model with bilayer expansion and mass threshold fitted to the data (red line). (D): experimental data for Helix 8 binding to DMPC/DMPS/PI(4,5)P2 (blue line), with the three-state model with bilayer expansion and mass threshold fitted to the data (red line).

