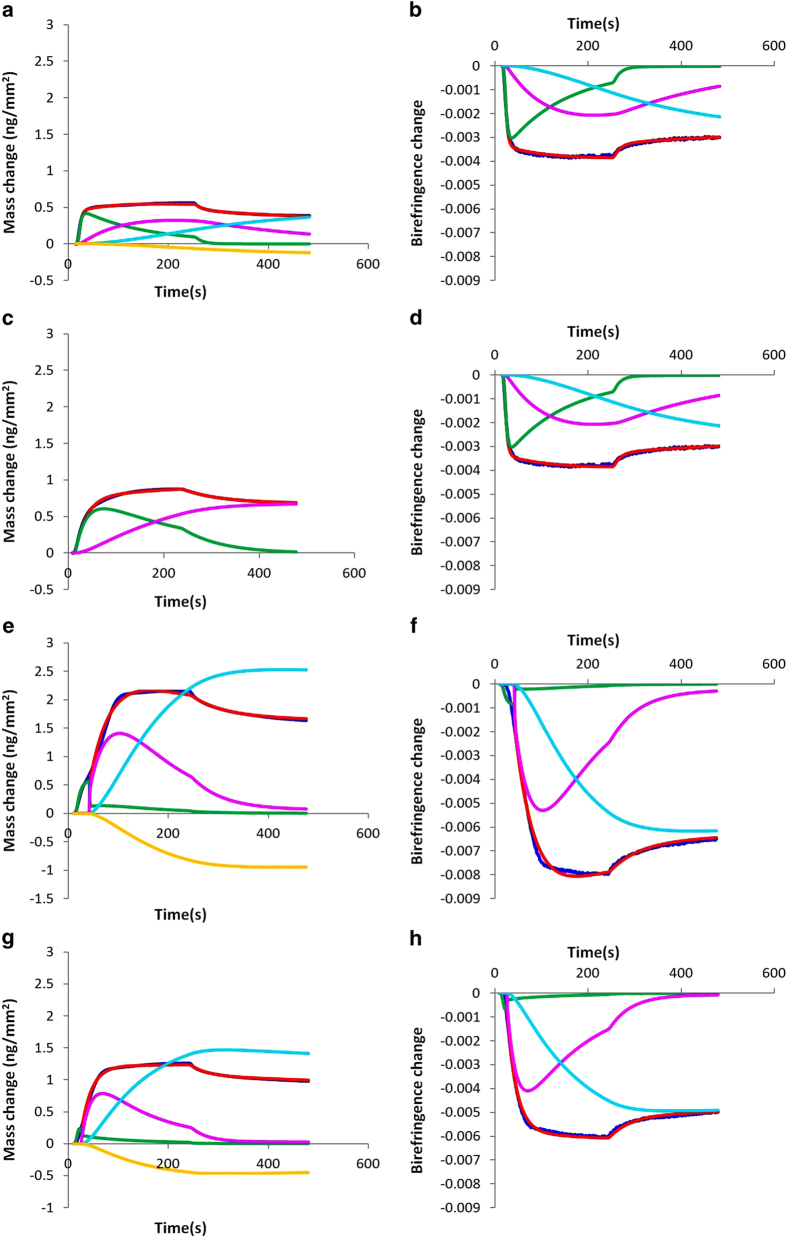
Figure 4.
Deconvolution of peptide states for mass and birefringence change vs. time for the binding of 10 μM Helix 8 for lipid bilayers and model corresponding to Fig. 3, showing, where applicable, experimental data (blue line) and the model mass/birefringence change (red line), first state (green line), second state (magenta line), third state (cyan line), and effect of bilayer expansion (yellow line). Graphs are for the following lipids and models: DMPC using a three-state model with bilayer expansion, mass changes (A) and birefringence changes (B); DMPC/DMPS using a two-state model without bilayer expansion, mass changes (C) and birefringence changes (D); DMPC/DMPS/PI(4)P using a three-state model with a mass threshold and bilayer expansion, mass changes (E) and birefringence changes (F); DMPC/DMPS/PI(4,5)P2 using a three-state model with a mass threshold and bilayer expansion, mass changes (G) and birefringence changes (H).

