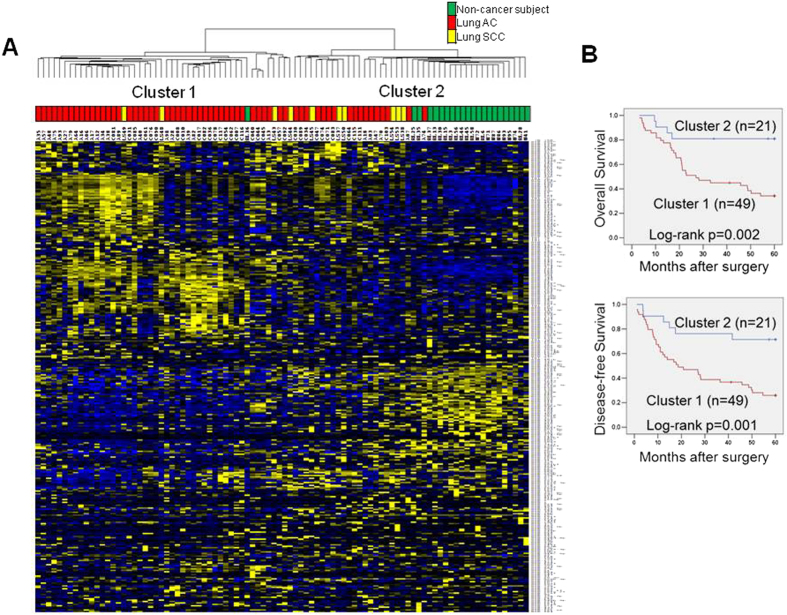
Figure 1. Hierarchical clustering analysis of serum miRNA expression.
(A) Two major clusters were identified by unsupervised clustering analysis based on 334 expressed miRNAs in the serum of 70 NSCLC patients and 22 NC subjects. Samples are depicted in columns and microRNAs in rows. The histology of the samples (AC, adenocarcinoma; SCC, squamous cell carcinoma) is depicted in different colors at the top of the heat map. Overexpressed miRNAs are displayed in yellow whereas down-regulated microRNAs are displayed in blue. (B) Kaplan-Meier plot of overall survival and disease-free survival according to the cluster groups. Patient whose serum samples did not cluster with NC samples had significantly worse outcome.

