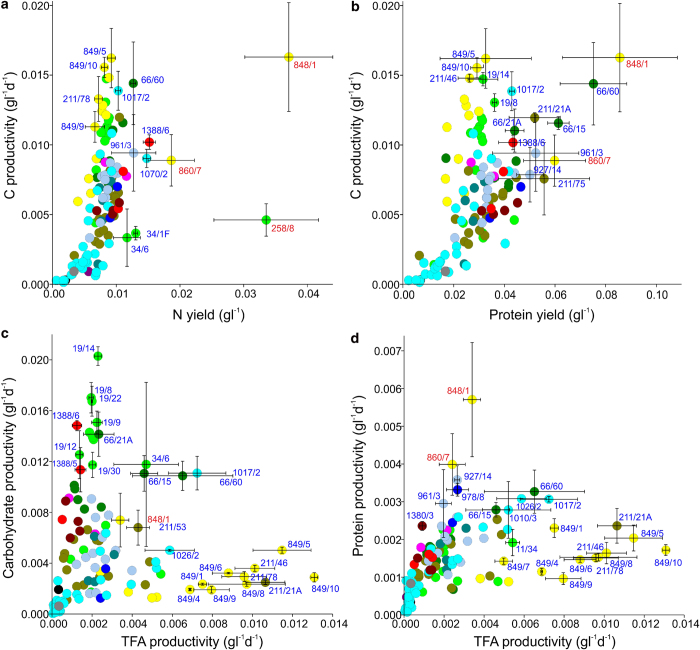
Figure 4. C and N resource partitioning in the algal screen.
C productivities are depicted in comparison with assimilation of supplied N in terms of (a) N culture yield (b) protein. Comparison of TFA production levels with (c) carbohydrate and (d) protein. Data points are colour coded by class as defined in Fig. 1 (2° screen) and error bars (SD) are depicted for key algae labelled according to CCAP strain accession number (red text indicates strains grown in 3NBBM+V). Data are from 117 strains and are derived from replicate batch cultures (tabulated in Supplementary Dataset S4 online).

