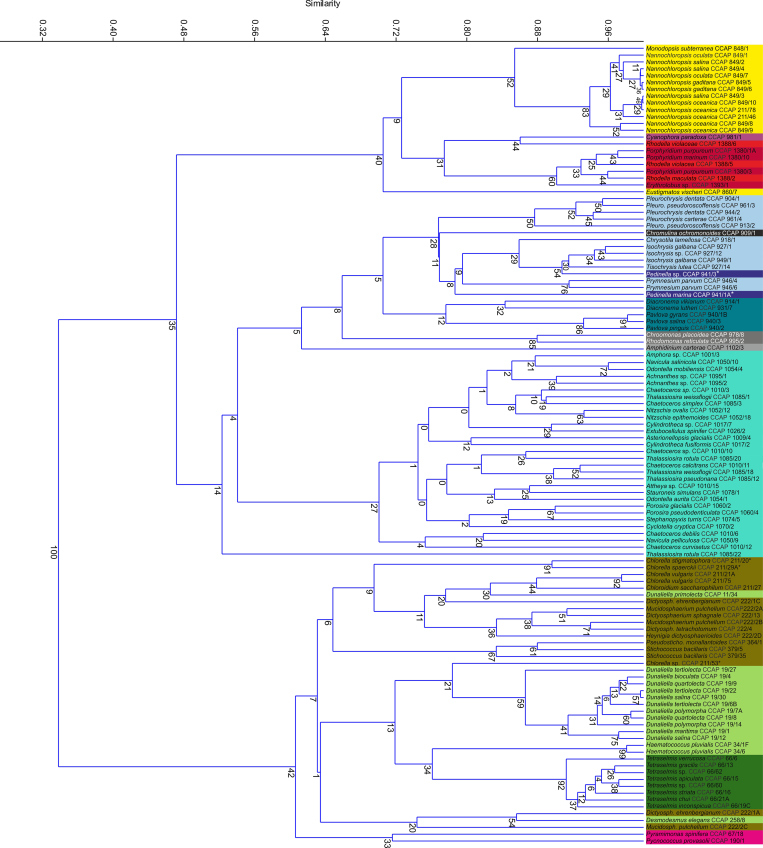
Figure 5. Cluster analysis of FA compositional data.
A data cut-off of 0.1% was applied and data (mol%) clustered using a PAST algorithm employing Rho parameters (bootstrap value N = 1000). Micro-algal classes were defined by the colour-coding scheme in Fig. 1 (2° screen). Strains undergoing taxonomic review are indicated (*); see Supplementary Text S1 online. Data tabulated in Supplementary Dataset S6 online.

