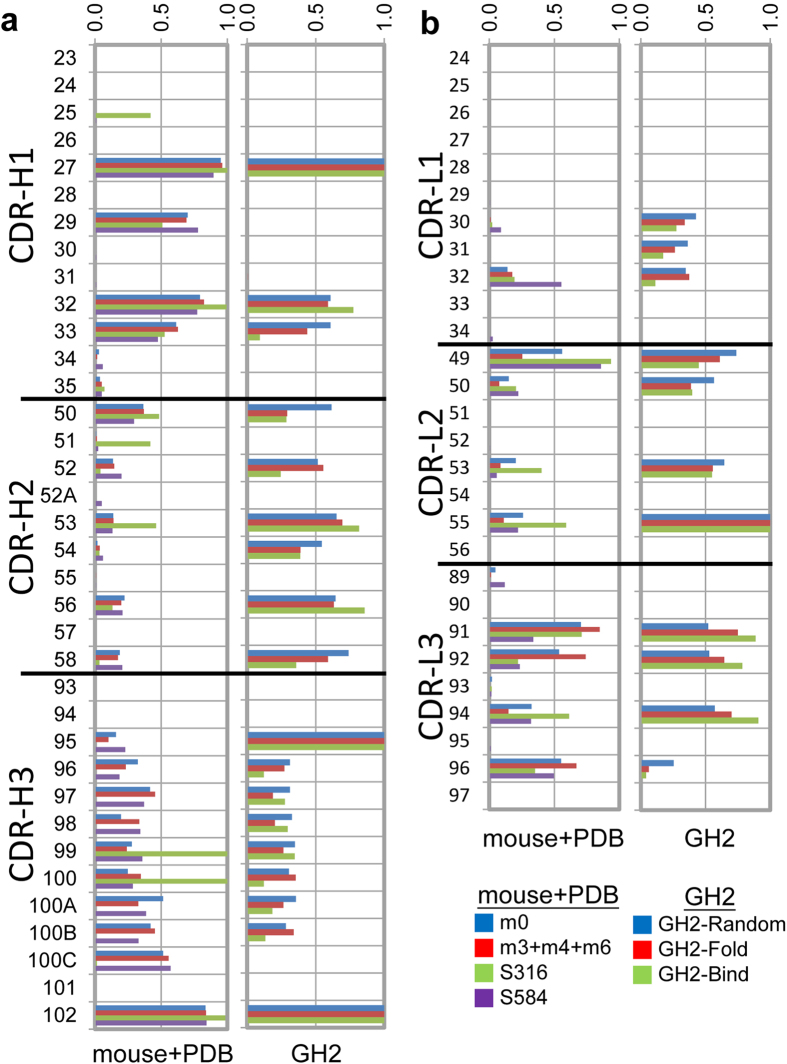
Figure 3. Comparison of the aromatic residue frequencies for the CDR residue positions in GH2 antibody library with those in mouse antibody repertoires and in antibody structures in PDB with the same respective CDR structures.
(a) CDR residue positions are marked in Kabat number for the 1-2-2-1-1 variable domains with 11-residue CDR-H3. The histograms in the left-hand side panel show the frequencies of aromatic residues in each CDR residue position in antibody repertoires from the m0 mouse (blue), m3+m4+m6 mice (red), from S316 (green), and from S584 (data set containing 584 non-redundant antibody structures from PDB). The panel in the right-hand side shows the frequencies of aromatic residues in each CDR residue position in the theoretical GH2 antibody library (blue), in the well-folded and expressed scFvs of the GH2 antibody library (red), and in the GH2 scFvs that bound to various protein antigens (green). (b) Aromatic residue frequencies in light chain CDR residue positions are compared. The descriptions are the same as in (a).

