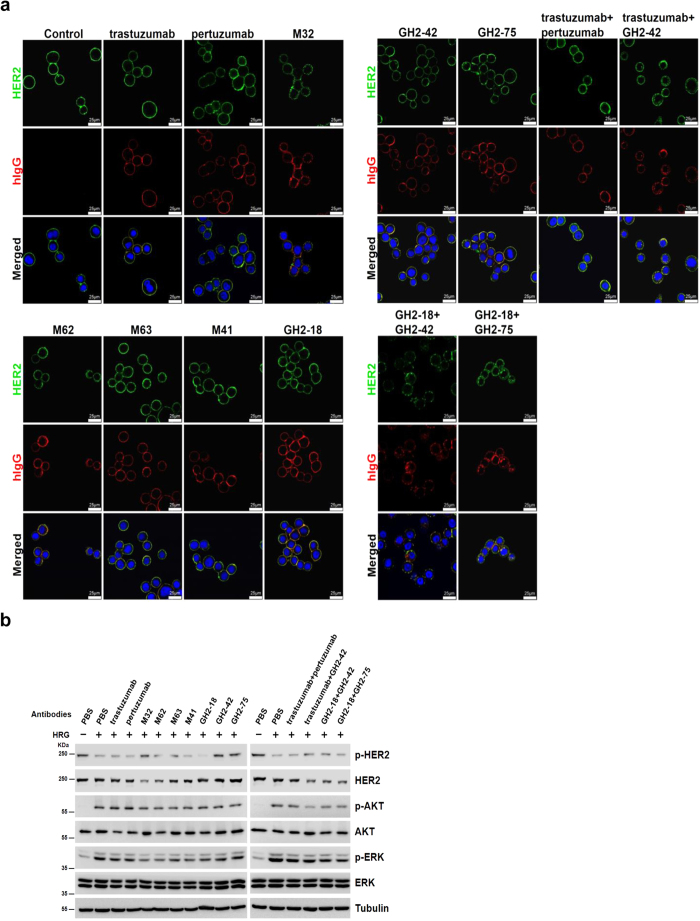
Figure 7. Functional analysis of anti-HER2 antibodies from immunized mice or from GH2 library.
(a) SKBR3 cells were treated with 2 μg/mL of IgG(s) as indicated above the panels. HER2 was visualized by a commercial antibody recognizing HER2 intracellular domain followed by fluorescence conjugated anti-rabbit IgG secondary antibody (green, top panels); antibodies treated were visualized by fluorescence conjugated anti-human IgG secondary antibody (red, middle panels). DAPI was used to visualize nuclei (blue, bottom panels). The yellow colored areas in the bottom panels are the areas of co-localization of HER2 and treated IgG(s). (b) Antibody-induced HER2 depletion and inhibition of downstream signaling in breast cancer cells are compared among different antibody treatments. SKBR3 cells were seeded in 12 well plate. After overnight starvation, the cells were incubated with PBS (control) or antibodies (indicated above the Western blot panels, 2 μg/mL) for 18 hours. The cells were treated with 30 ng/mL of HRG (heregulin) for 15 minute before cell lysis. Phospho-ERK (extracellular-signal-regulated kinase) (pERK), ERK, phospho-AKT (protein kinase B) (pAKT), AKT, phospho-HER2 (pHER2), and HER2 in cell lysates were quantitated by Western blotting as shown in the panels. Tubulin (Tub) was used as internal control.

