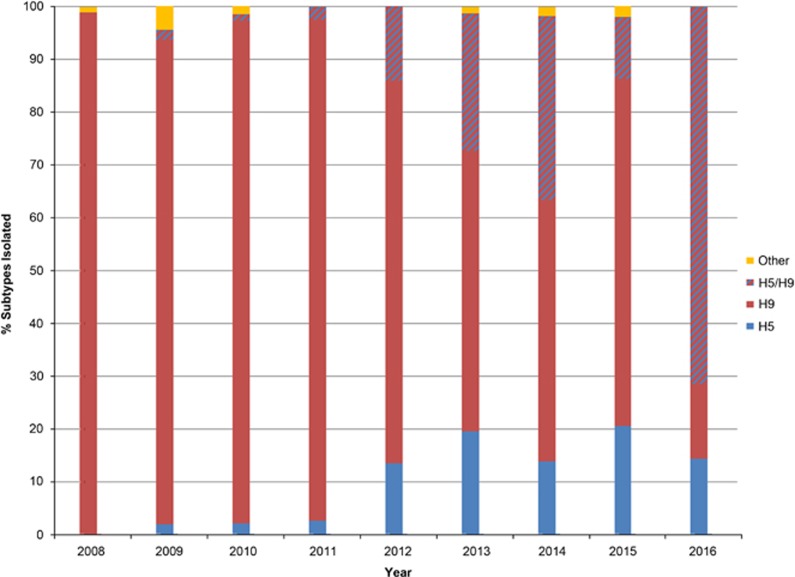
Figure 2.
The percentage of subtypes isolated by year of surveillance in Bangladesh. Bar graph shows the percentage of samples that were isolated from eggs and subtyped each surveillance year. Samples that were isolated as co-infections of H5N1 and H9N2 are depicted with the red and blue striped bars. Other subtypes that were isolated include HA subtypes 1, 3–7, 10 and 15 in various combinations with NA subtypes 1–3 and 5–9.

