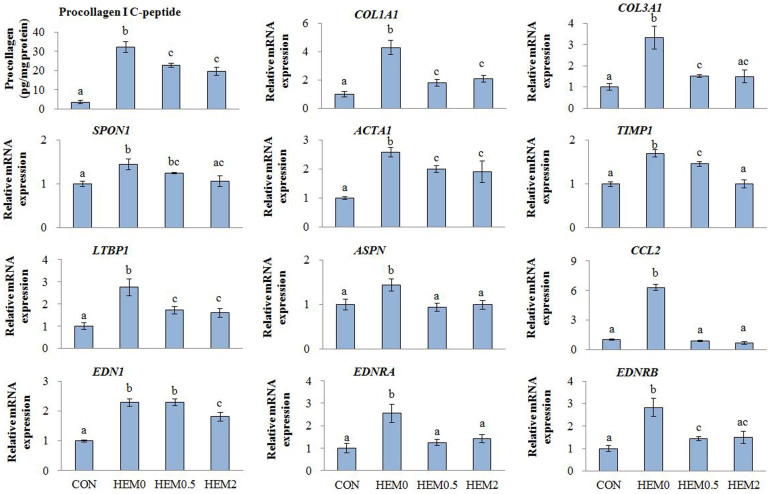
Figure 1. Effects of HEM on procollagen Type I C-peptide production in media, and gene expression in TGFβ1-treated C3A cells.
CON, C3A cells without TGFβ1 stimulation; HEM0, without HEM addition; HEM0.5 and HEM2, 0.5 and 2 mg/mL of HEM addition, respectively. Results are means ± SE in each group (n = 3). Data with different letters (a, b, c) are significantly different at P < 0.05 by Dunnett's test.

