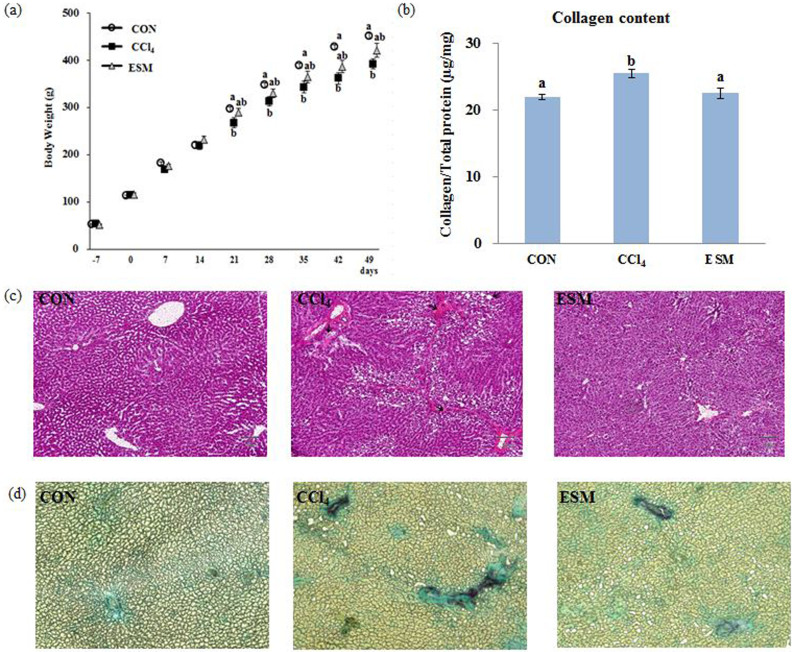
Figure 2. Changes in body weight (a), collagen content in liver (b), and histological features using H&E staining (c), Sirius red/Fast green staining of liver sections (d).
CON, control rats; CCl4, rats administered only CCl4; ESM, rats administered CCl4 and ESM (20 g kg−1). Results are means ± SE in each group (n = 6). Data with different letters (a,b,c) are significantly different at P < 0.05 by Dunnett's test.

