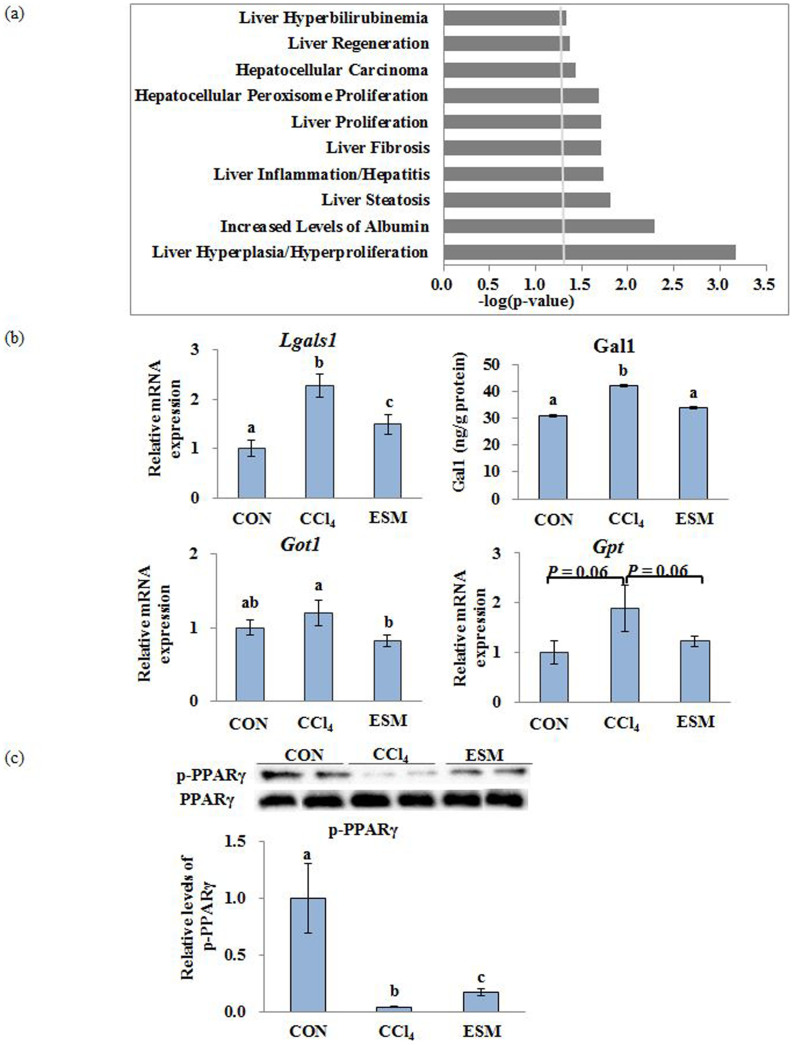
Figure 4.
‘Liver Tox Function’ categorized by IPA (threshold > 1.25) of differentially expressed proteins by iTRAQ analysis (a). Validation of differentially expressed proteins (b). Western blotting analysis of p-PPARγ protein levels in rat liver (c). CON, control rats; CCl4, rats administered CCl4; ESM, rats given CCl4 and ESM (20 g kg−1). Results are means ± SE in each group (n = 6). Data with different letters (a,b,c) are significantly different at P < 0.05 by Dunnett's test.

