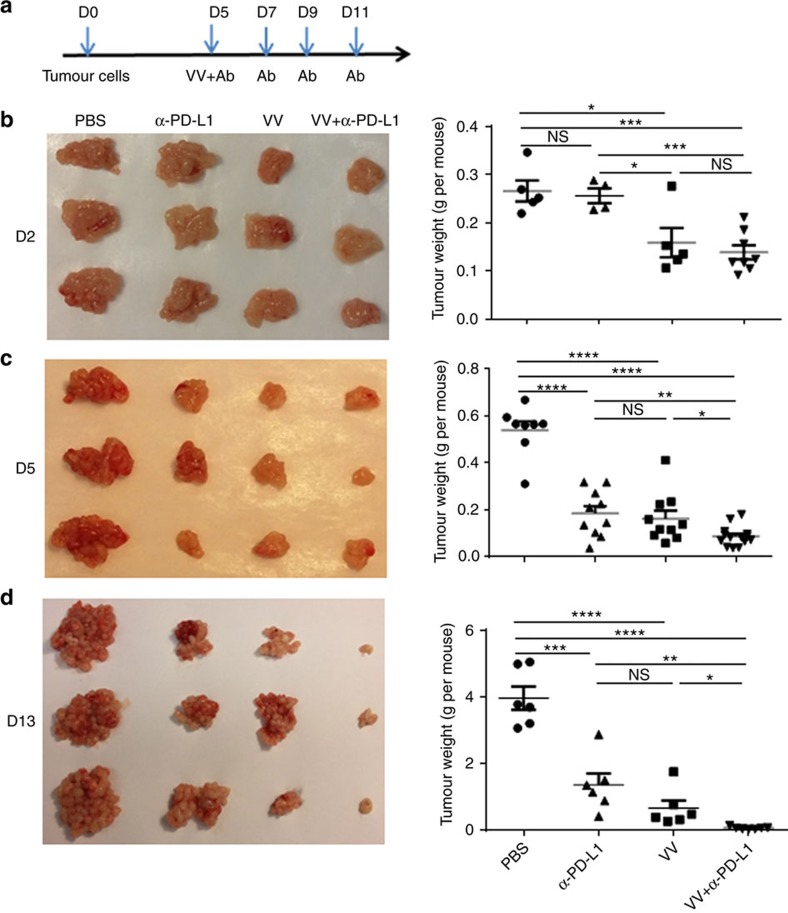
Figure 3. Primary tumour growth is dynamically monitored post treatments.
B6 mice were intraperitoneally inoculated with 5 × 10⁵ MC38-luc cancer cells and treated as described. Tumour-bearing mice were killed on days 2, 5 and 13 after first treatment, and primary tumour tissues were collected. Shown are schematic representations of the experiment (a) or weight of primary tumours on day 2 (b), day 5 (c) and day 13 (d) post first treatment. Numbers of mice per group are 5–11 (n=5∼11). In photographs, only representative three tumours from each group are shown. In the figures, VV=vvDD-CXCL11. Data were presented as individuals and means. Student's t-test was used to analyse the statistical significance (*P<0.05; **P<0.01; ***P<0.001; ****P<0.0001; and NS: not significant).

