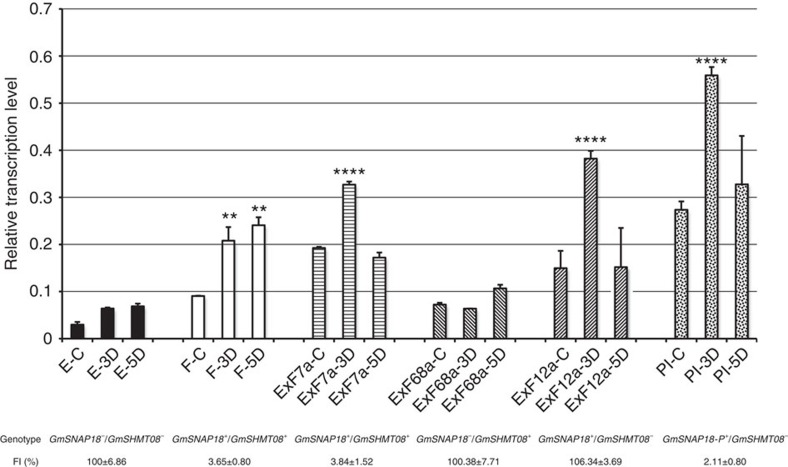
Figure 4. Quantitative RT–PCR analyses of GmSNAP18 in the roots at different days after SCN infection and phenotype assays of soybean lines and ExF RILs with different genotypes of GmSNAP18 and GmSHMT08.
Roots without SCN infection were used as control. D, days after SCN infection; E, Essex; F, Forrest; PI, PI 88788. GmSNAP18+ and GmSNAP18−, and GmSHMT08+ and GmSHMT08− represent Forrest and Essex GmSNAP18, and Forrest and Essex GmSHMT08, respectively; GmSNAP18-P+ represents PI 88788 GmSNAP18. Five replicates each line were performed, except for few lines with only three or four replicates due to one or two seeds that did not germinate. The error bar stands for the s.e.m. Asterisks indicate significant differences between samples as determined by t-test (****P<.0001 and **P<.01).

