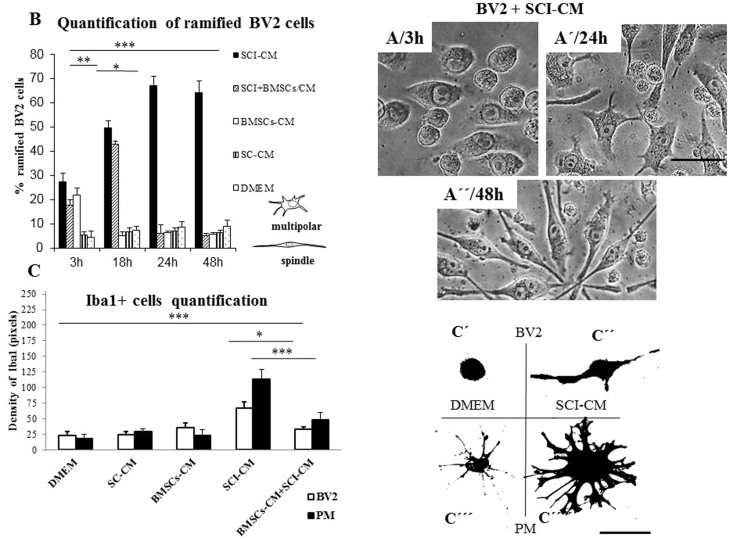
Figure 7. Quantification of stimulated BV2 cells based on their morphological changes (multipolar/spindle shape) (Figures 7A–A″) after incubation with SCI-CM, SCI-CM + BMSCs-CM, BMSCs-CM and SC-CM from 3 h to 48 h.
Note the higher % of ramified BV2 cells in time after incubation with SCI-CM (B). Quantification of Iba1+ microglia morphological changes within identical fields (C′ and C′′′′) treated with DMEM, SCI-CM, SCI-CM + BMSCs-CM or BMSCs-CM (C). Note, representative morphology of BV2 cells with round oval shape (C′) and PM with small soma extending to few long thin processes treated with DMEM (C′′′), while after treatment with SCI-CM, BV2 cells with enlarged bipolar morphology (C″) and PM with hypertopied multipolar cell body and retracted thick processes occurred. Data are represented as mean ± SEM. *P < 0.1, **P < 0.01, *** P < 0.001, one-way ANOVA followed by Tukey-Kramer test. Scale bars A–A″, C′–C′′′′ = 20 μm.

