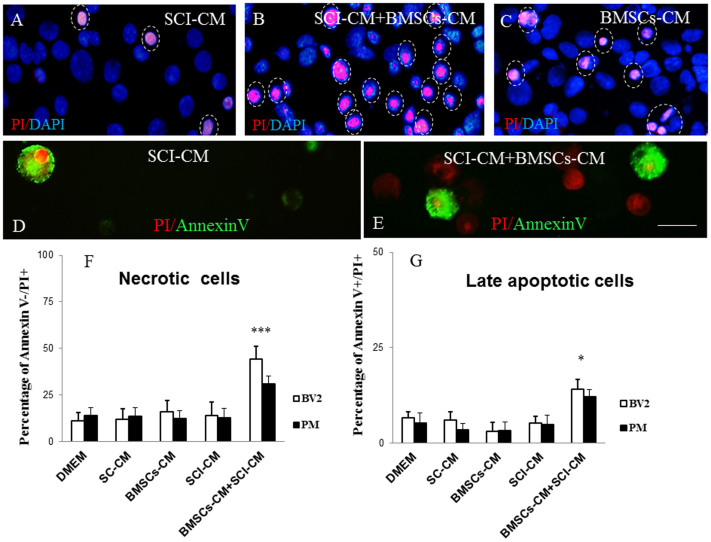
Figure 9.
PI and Annexin V (AV) labeling of BV2 cells (D, E) counterstained with Dapi (A–C). Note, the highest number of late apoptotic or necrotic (PI+/AV+, PI+/AV−) BV2 cells exposed to SCI + BMSCs/CM (B, E) when compared to incubation with SCI-CM with occasional late apoptotic (PI+/AV+) and early apoptotic cells (PI−/AV+) (A,D) or BMSCs-CM (C) (purple, indicated by dashed circles) at 48 h. PI/red, Annexin V/green labeled BV2 cells (D,E). Bar graph reporting the percentage of necrotic and late apoptotic microglia cells after different CM treatment after 48h in vitro incubation. Data are represented as mean ± SEM. *P < 0.1 **P < 0.01, *** P < 0.001, one-way ANOVA followed by Tukey-Kramer test (F,G). Scale bars A-E = 20 μm.

