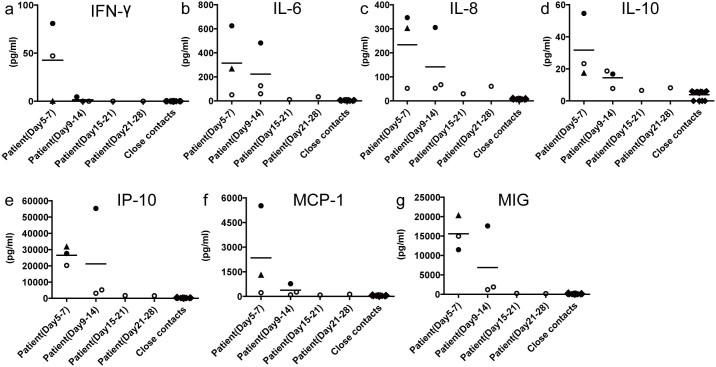
Figure 2. Sera chemokine/cytokine levels of patients acutely infected with avian H10N8 virus.
The sera concentrations of the chemokines/cytokines IFN-γ (A), IL-6 (B), IL-8 (C), IL-10 (D), IP-10 (E), MCP-1 (F) and MIG (G) were measured using cytometric bead array assays, according to the manufacturers' instructions. Series of sera were collected on days 5 and 9 after disease onset for Case 1 (filled round), on days 7, 10, 14, 21 and 28 after disease onset for Case 2 (open round) and on day 5 after disease onset for Case 3 (filled triangle); sera were also collected from 13 close contacts. The data was analyzed by GraphPad Prism 5 software package (GraphPad Software) and the data graph was constructed by JZ using Adobe Illustrator CS6 software.

