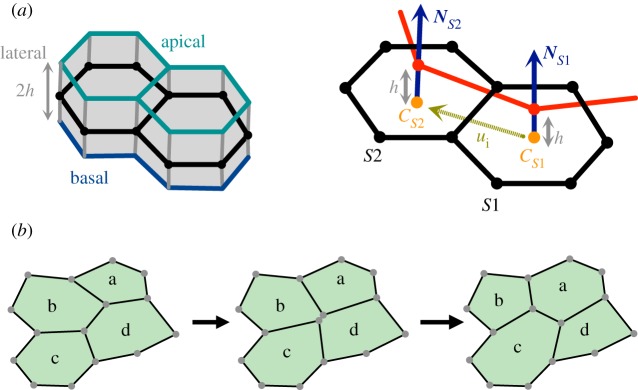
Figure 3.
Two-dimensional model for three-dimensional epithelial deformations. (a) Schematic of an epithelial monolayer with thickness 2h. The two-dimensional model approximates the epithelial sheet by its midsurface (shown in black). (b) Two adjacent cells and their respective cell centres and unit normal in this model. The red line highlights a contractile segment that is offset by a distance h from the surface along the cell normals. Images are taken from [21]. (c) Schematic of a T1 transition event, in which a vanishing edge is resolved into a new edge reflecting new local cell connectivity (described in greater detail in electronic supplementary material, section S1).

