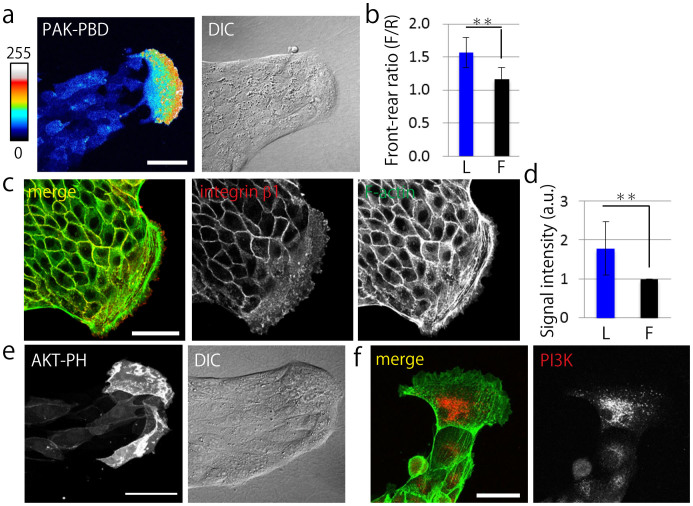
Figure 2. Rac, integrin β1, and PI3K are upregulated in leader cells.
(a) Fluorescent image of the typical finger-like structure exhibited by MDCK cells expressing PAK-PBD-AcGFP. DIC: Differential interference contrast image. Fluorescent intensity is represented with colors from hot to cold. (b) Quantification of the ratio of the mean fluorescent intensity of PAK-PBD-AcGFP determined in a region of the leading front (F) divided by the signal intensity of the trailing rear (R) (N = 15). (c) Fluorescent images of integrin β1 stained by AIIB2. Red: integrin β1. Green: F-actin. (d) Quantification of the fluorescent intensity of integrin β1 at the bottom of cells. L: leader cells, F: follower cells. The signal intensity of leader cells was normalized by that of the follower cells (N = 8). (e) Fluorescent images of collectively migrating MDCK cells expressing AKT-PH-GFP. (f) Fluorescent images of PI3K. Green: F-actin, Red: PI3K. (a, c, e, and f) Scale bars: 50 μm. (b and d) The mean value ± S.D. **P < 0.01 by Student's t-test.

