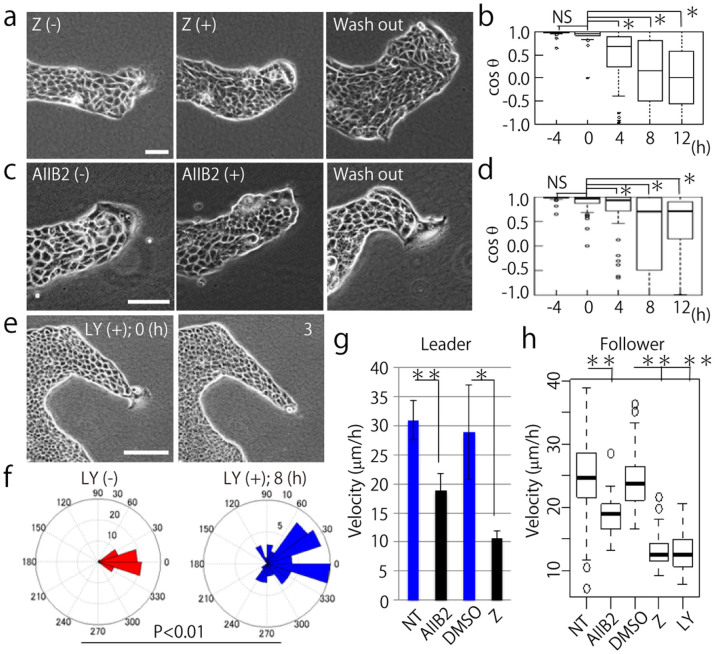
Figure 5. Inhibition of Rac1, integrin β1, and PI3K disrupts collective migration of MDCK cells.
(a, c, and e) Time-lapse phase contrast images of migrating MDCK cells. (−) indicates before and (+) represents after inhibition. (a) Rac1 inhibition with Z62954982 (100 μM). (c) integrin β1 inhibition with AIIB2 (1.5 μg/ml). (e) PI3K inhibition with LY294002 (10 μM). Wash out means washing or removal of the inhibitor with fresh medium. Scale bars: 100 μm. (b and d) The angles between the migration direction of leader cells and follower cells treated with inhibitors are shown by cosθ. (b) Z62954982 (100 μM) and (d) AIIB2 (1.5 μg/ml) was treated at time 0. NS: non-significant, *P < 0.01 by Wilcoxon rank sum test. Twenty follower cells were randomly chosen in each experiment (N = 3). The mean value ± S.D. (f) Migratory direction of follower cells before and after PI3K inhibitor treatment. Twenty follower cells were analyzed from each experiment (N = 3). NS: non-significant, *P < 0.01 by Watson's two-sample test of homogeneity. (g) The migration velocity of leader cells under inhibitor treatment. NT: before treatment. AIIB2: integrin β1 inhibitor (1.5 μg/ml), DMSO: negative control, Z: Rac1 inhibitor (Z62954982, 100 μM) (at least N = 3). **P < 0.01, *P < 0.05. The mean value ± S.D. (h) The migration velocity of follower cells with each inhibitor. The inhibitor concentrations were the same as (g), and the PI3K inhibitor (LY294002) concentration used was 10 μM. Twenty follower cells were randomly chosen from 1 image (N = 3). **P < 0.01. The mean value ± S.D.

