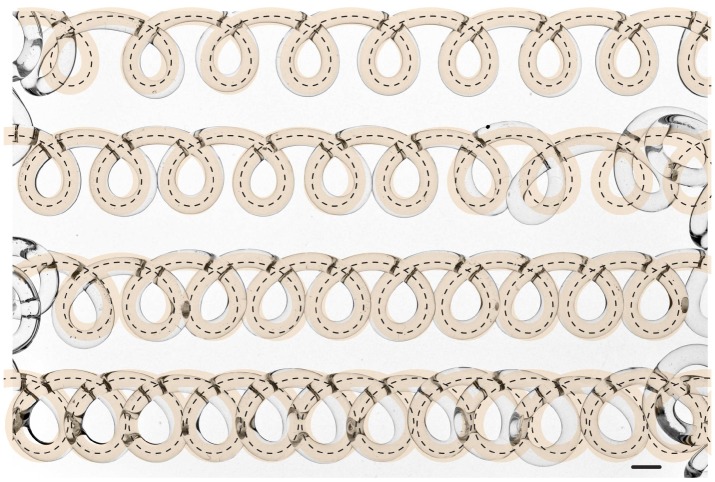
Figure 4.
Comparison between theoretical and experimental results. Experimental photographs of the glass pattern obtained with a nozzle of radius a0= 5 mm, height of fall H=100 mm and nozzle speed Vn= [9,8,7,6] mm s−1 from top to bottom serves as a background of the image. It is compared with the numerical results obtained by integrating equation (3.5) using the values Rc=6.8 mm, Ωc=2π/1.62 s−1, so that Uc≃26 mm s−1, and the value of Vn corresponding to each row. The dotted line represents the centreline as predicted by theory, and the transparent orange lines are the result of reconstruction obtained giving adequate thickness to this line in order to best fit the pattern. The scale bar is 5 mm in length. (Online version in colour.)

