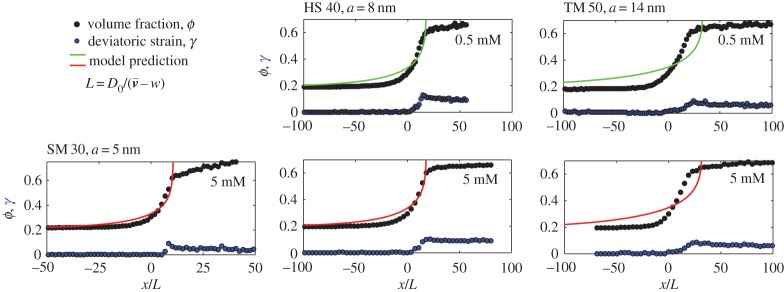
Figure 7.
The liquid–solid transition was observed in the drying of five different dispersions, with various particle sizes and salt concentrations. The solid volume fraction slowly increases from the left to the right of each graph, as the particles are packed closer and closer to each other. Distances are rescaled by the advection–diffusion length  , to highlight the effects of charge on stretching out the transition region (for non-interacting particles, the transition should occur over a length L). Shown are the volume fraction (ϕ, black points, equation (3.1)) and deviatoric strain (γ, blue points, equation (3.2)). The results of the model calculations are shown as solid curves, assuming a surface charge density σ=0.5 e nm−2. All figure data are provided as the electronic supplementary material.

