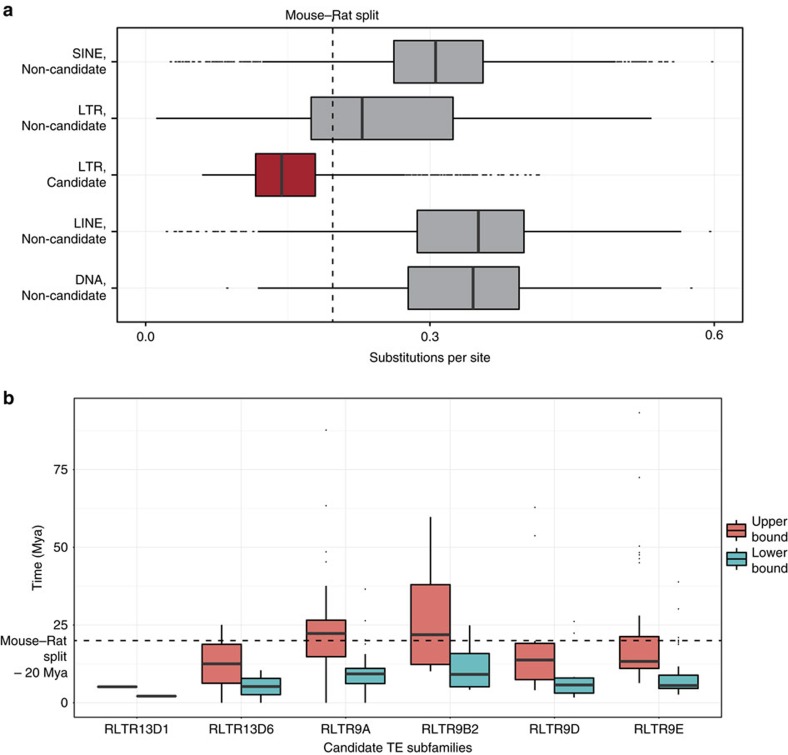
Figure 2. Evolutionary age estimates of TE subfamilies enriched for multiple TF-binding sites.
(a) Distribution of the substitution rate (that is, substitutions per site), based on the Juke–Cantor model for individual elements. ‘Candidate' represents the six TE subfamilies (that is, RLTR9A, RLTR9B2, RLTR9D, RLTR9E, RLTR13D1 and RLTR13D6), while all other TE subfamilies are labelled ‘Non-candidate'. See Methods for details on calculating the substitution rate. (b) Estimates of the time of insertion (y axis; million years ago (Mya)) of the six TE subfamilies (x axis). See Methods for details on calculation of time of insertion. We used two estimates of mutation rates—an upper and lower bound (as labelled in the figure legend)—to estimate the time of insertion. In box plots, the centre line represents the median, the box limits represent the 25th and 75th percentiles and the whiskers represent the minimum and maximum values in the interquartile range.

