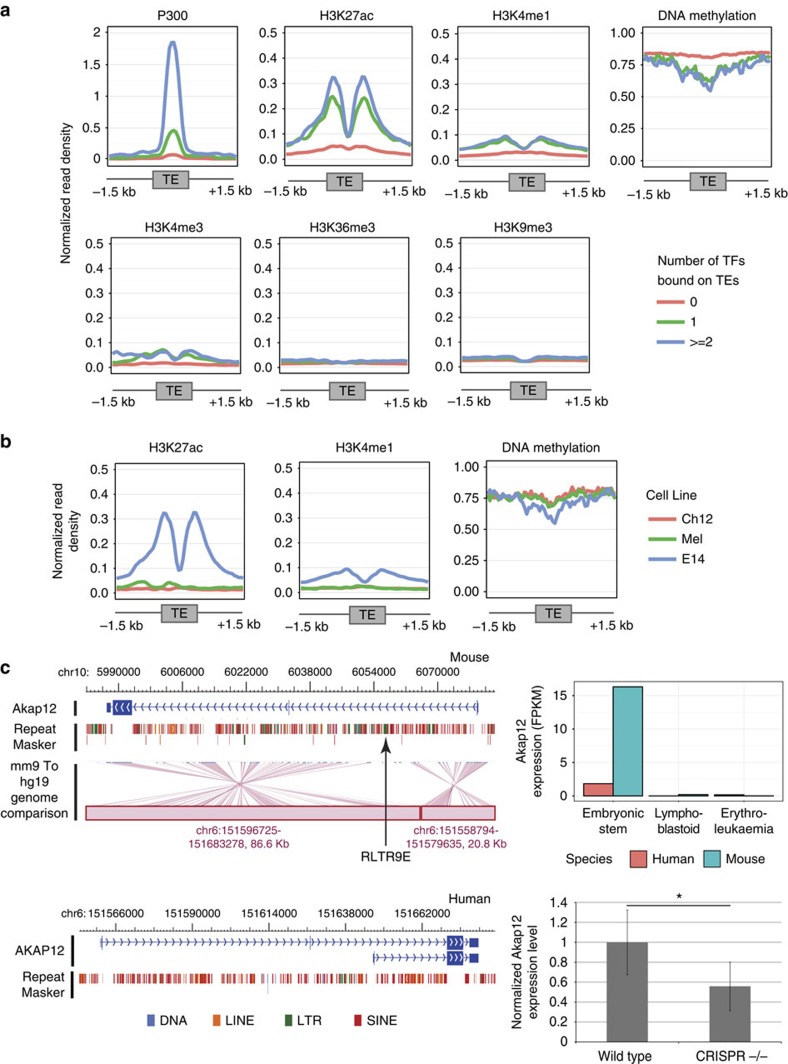
Figure 3. Epigenetic signature of TEs bound by pluripotency TFs.
(a) Normalized read density of various epigenetic marks in mouse ESCs (E14) on 3-kb regions centred on TEs (belonging to the six candidate TE subfamilies—RLTR9A, RLTR9B2, RLTR9D, RLTR9E, RLTR13D1 and RLTR13D6) that were bound by one and two or more pluripotency TFs, compared to TEs from the same subfamilies that were not bound. (b) Normalized read density of enhancer epigenetic marks in mouse ES (E14), lymphoblastoid (Ch12) and erythroleukemia (Mel) cell lines, on 3-kb regions centred on TEs (that is, six candidate TE subfamilies) that were bound by two or more TFs. (c) Genome view (WashU Epigenome Browser)68 of the Akap12 locus in the mouse genome (mm9: top-left panel), and human genome (hg19: bottom-left panel). The genome comparison track (mm9 to hg19) indicates orthologous regions in mouse (blue) and human (red). The mouse-specific RLTR9E element is marked in the mouse panel. Top-right panel: expression level (FPKM) of Akap12 that is likely a target of the RLTR9E element and exhibits a mouse ESC-specific expression pattern (as identified by DESeq analysis—see Methods). Bottom-right panel: normalized expression level of Akap12 (measured by qRT-PCR) in mouse ESCs (labelled ‘Wild type') and when the RLTR9E element was deleted (using CRISPR/Cas9; labelled ‘CRISPR−/−'). * represents P value=0.02, as measured by Student's t-test across two biological and three technical replicates. Error bars represent s.d.

