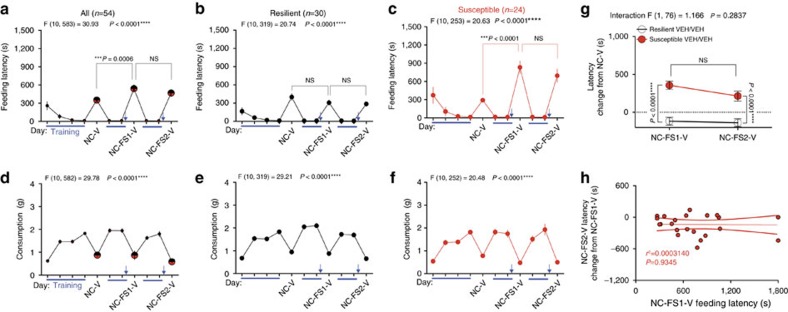
Figure 3. Stress susceptibility is a stable trait.
(a–c) Home cage training (blue lines) and novel cage (NC-V) latencies and (d–f) consumption across one baseline and two novel-cage foot-shock stress tests (NC-FS1-V and NC-FS2-V) with vehicle treatment. (g) Direct comparison of the latency change from baseline between the two post-stress NIH novel cage tests. (h) Correlation between the first stress-test latency and the change in latency between the 2nd and 1st stress novel-cage tests for susceptible individuals. Blue arrows indicate foot-shock stress exposure. F and P values for one-way (a–f) or two-way (g) ANOVA shown above individual panels. P values shown for pairwise comparisons from Holm-Sidak multiple comparisons test after ANOVA. R2 and P value for linear regression shown in h. Data are presented as mean±s.e.m.

