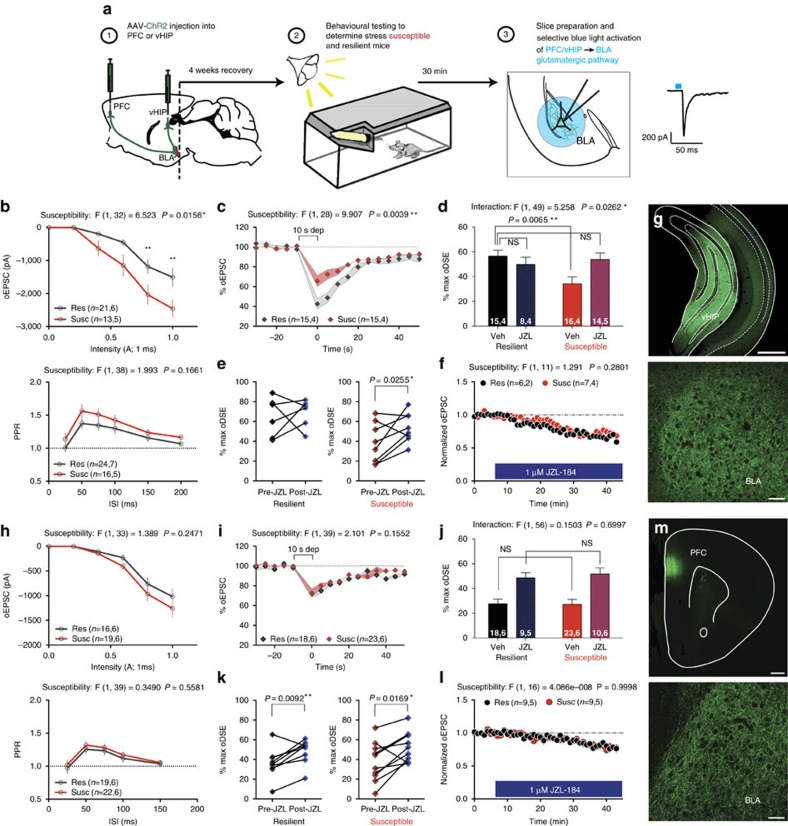
Figure 9. Stress-resilience is associated with greater 2-AG modulation of vHIP-BLA glutamatergic synapses.
(a) Schematic of the experimental procedure for optogenetic recordings. (b–g) Optogenetic recordings at vHIP-BLA synapses. (h–m) Optogenetic recordings at PFC-BLA synapses. (b,h) Optically evoked input-output curves and paired pulse ratio. (c,i) Depolarization-induced suppression of excitation (oDSE) in susceptible and resilient population. (d,j) Direct comparison of the effect of JZL-184 on the magnitude of oDSE in resilient versus susceptible groups. (e,k) Paired comparison of % maximal oDSE in the same cell pre- and post-JZL-184 incubation for resilient and susceptible groups. (f,l) 1 μM JZL-184-induced depression of optically evoked EPSCs. (g,m) Representative images of the vHIP and PFC injection sites, and the corresponding BLA recording sites. Number of (cells, animals) are presented within each panel. F and P values for two-way ANOVA shown above individual (b–d,f,h–j,l). P values shown for pairwise comparisons derived from Holm-Sidak multiple comparisons test after ANOVA or paired two-tailed t-test (e,k). Data are presented as mean±s.e.m. Scale bars are 500 μm for vHIP and PFC images, 50 μm for BLA.

