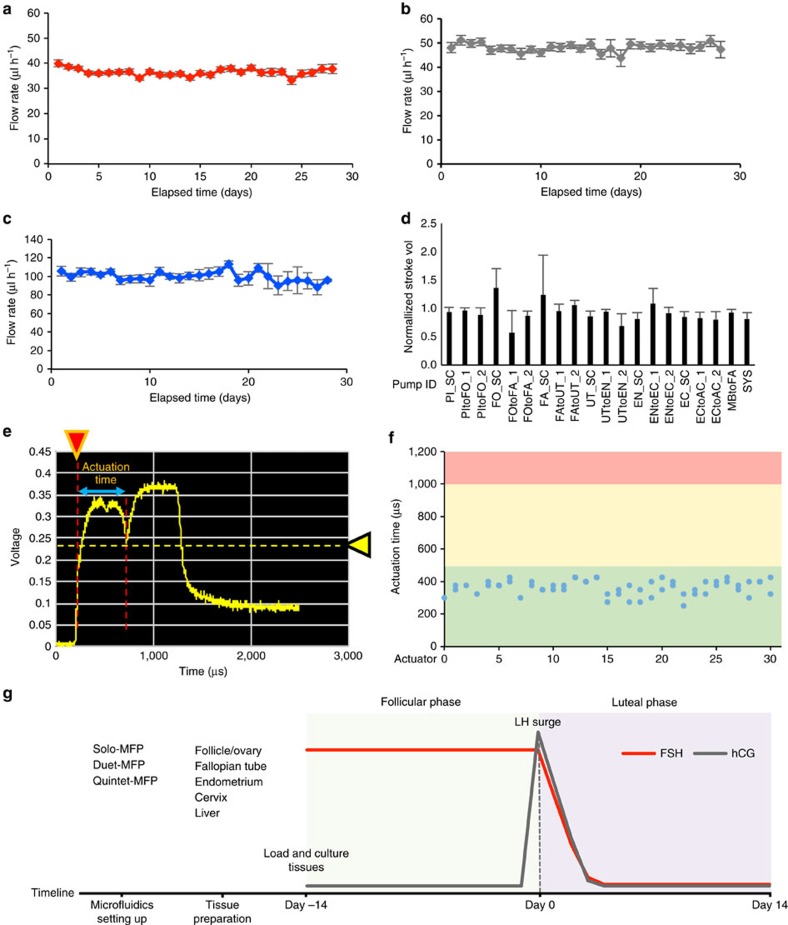
Figure 2. The pumping scheme of microfluidic platforms and experimental procedures.
The average flow rates of (a) Solo-MFP (n=19), (b) Duet-MFP (n=23) and (c) Quintet-MFP (n=10) systems. (d) Average stroke volume for each pump pathway in the Quintet-MFP over the course of 33 days normalized with respect to the initial value. (e) Example oscilloscope reading illustrating how the actuation time was measured to determine the status of actuator function. Red arrow: trigger position; yellow arrow: trigger level. (f) A plot of Quintet-MFP actuator status at the beginning of an experiment with the upper and lower bounds of 625 and 250 μs, respectively. (g) Timeline for microfluidic platform setup, tissue preparation and culture. Graphs in a–d display average+s.d. n=4 replicates for the microfluidic platform testing.

