
Figure 1.
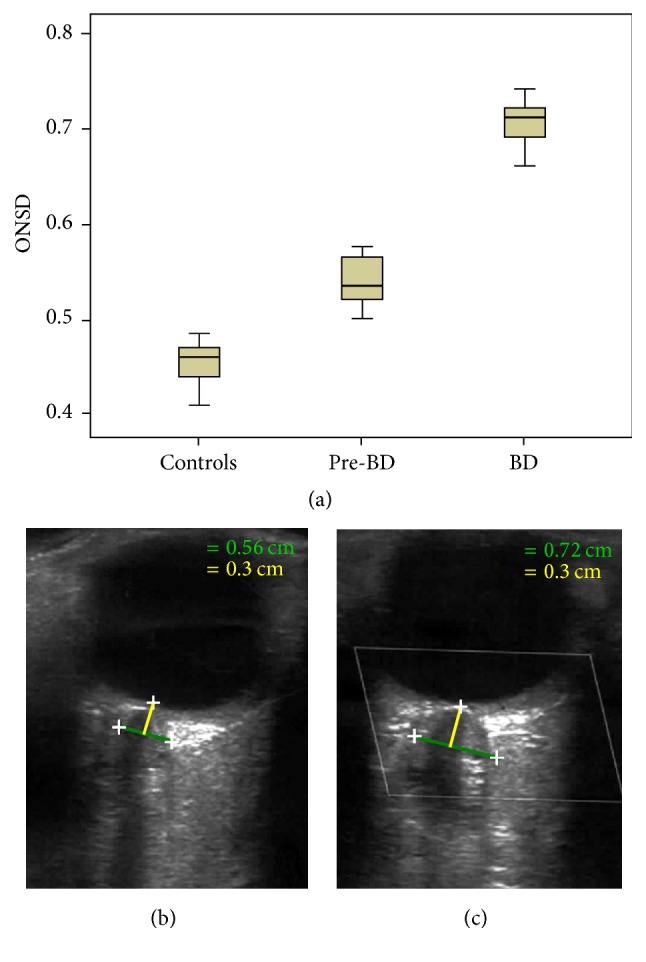
Box plot with interquartile range (IQR) distribution of ONSD values in patients and controls (a), with an example of two subsequent ONSD measurements in a patient in the pre-BD phase (b) and after BD occurrence (c). Marks indicate the optic nerve sheath, green line indicates the diameter, and yellow line indicates the measurement performed at the depth 0.3 cm behind the ocular globe.