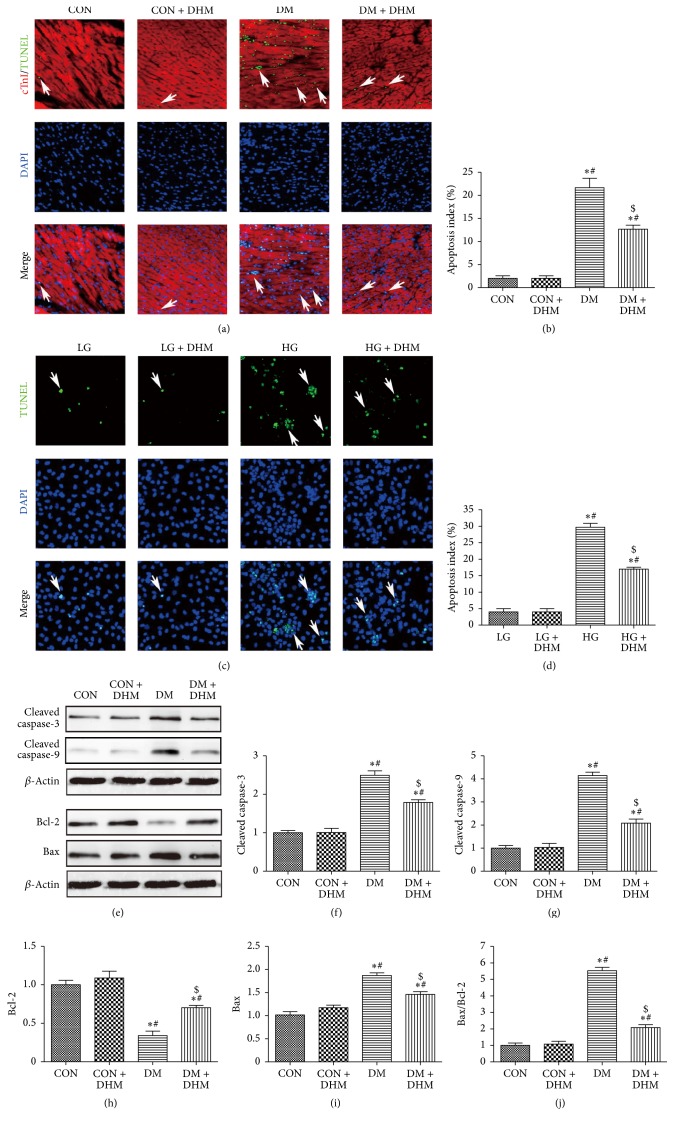
Figure 5.
Effects of DHM on cardiac apoptosis in STZ-induced diabetic mice. (a)-(b) Representative immunofluorescent images of staining with TUNEL (green), DAPI (blue), and Troponin T antibody (red) and quantification of TUNEL-positive cells. White arrows indicate apoptotic nuclei. The columns and error bars represent the means and SD (n = 6). ∗P < 0.05 versus CON; #P < 0.05 versus CON + DHM; $P < 0.05 versus DM. (c)-(d) Representative images of TUNEL-stained primary neonatal cardiomyocytes and quantitative analysis of the apoptotic index. White arrows indicate apoptotic nuclei. ∗P < 0.05 versus LG; #P < 0.05 versus LG + DHM; $P < 0.05 versus HG. The columns and error bars represent the means and SD. (e)–(j) Quantitative analysis of protein expression levels in the myocardium, with representative gel blots of caspase-3, cleaved caspase-3, caspase-9, cleaved caspase-9, Bcl-2, Bax, and β-actin. The columns and error bars represent the means and SD (n = 6). ∗P < 0.05 versus CON; #P < 0.05 versus CON + DHM; $P < 0.05 versus DM.

