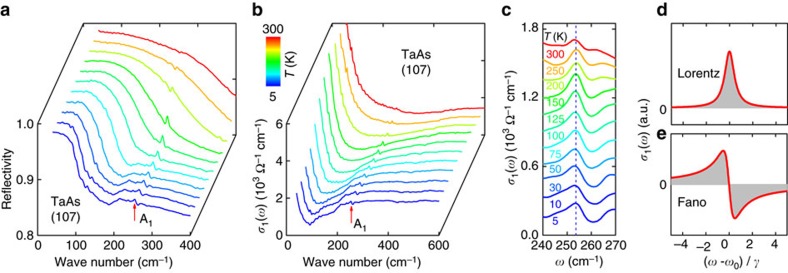
Figure 1. Reflectivity and optical conductivity of TaAs.
(a) Reflectivity of TaAs in the far-infrared region measured at different temperatures on the (107) surface. (b) Optical conductivity of TaAs on the (107) surface up to 600 cm−1 at different temperatures. (c) Enlarged view of the optical conductivity in the region of the infrared-active A1 mode at ∼253 cm−1. (d) Schematic of the symmetric Lorentz oscillator, which describes the phonon line shape in the optical conductivity without strong electron–phonon coupling. (e) Schematic of the asymmetric Fano resonance, used to describe the phonon line shape in the presence of strong electron–phonon coupling.

