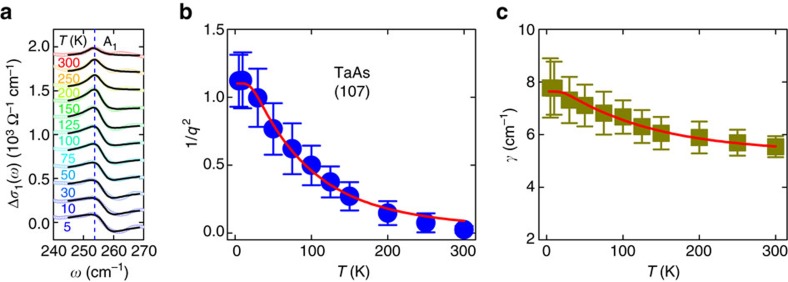
Figure 2. Fano fit and temperature dependence of fitting parameters.
(a) Line shape of the A1 phonon, with the electronic background subtracted at different temperatures. The black solid lines through the data denote the Fano fitting results. (b,c) Temperature dependence of the Fano parameter 1/q2 and the line width γ of the A1 mode, respectively. Error bars for both parameters are estimated by fitting the phonon line shape to the Fano equation in different frequency ranges at all measured temperatures. The red solid lines through the data in each panel represent the modelling results.

