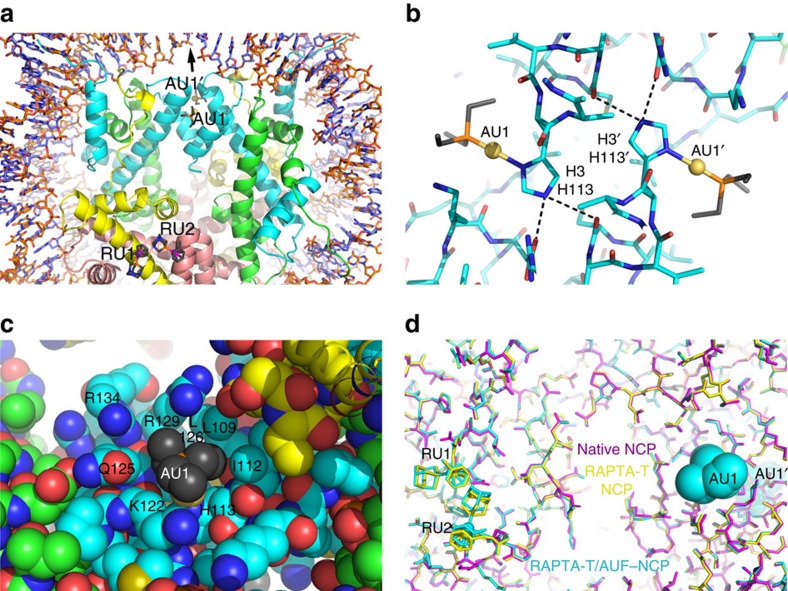
Figure 3. X-ray crystal structure of RAPTA-T/AUF–NCP.
(a–c) Structures of AUF and RAPTA-T adduct sites. H2A, H2B, H3 and H4 histone proteins are shown respectively with yellow, salmon, cyan and green backbone colouring. (a) Overview of AUF and RAPTA-T binding, illustrating the ≥27 Å separation of the two types of adducts. The arrow indicates the pseudo-twofold symmetry axis of the nucleosome. (b) Structure of the AUF-histone adducts. Dashed lines indicate hydrogen bonding with the H3 H113 imidazole epsilon nitrogen groups. (c) The van der Waals environment of an AUF adduct, shown in space-filling representation. (d) Superposition of the native NCP (magenta), RAPTA-T–NCP (yellow) and RAPTA-T/AUF–NCP (cyan) models, illustrating that the structures of the RAPTA-T-containing models are nearly identical, whereas that of the native NCP differs subtly in the vicinity of where the adducts form.

