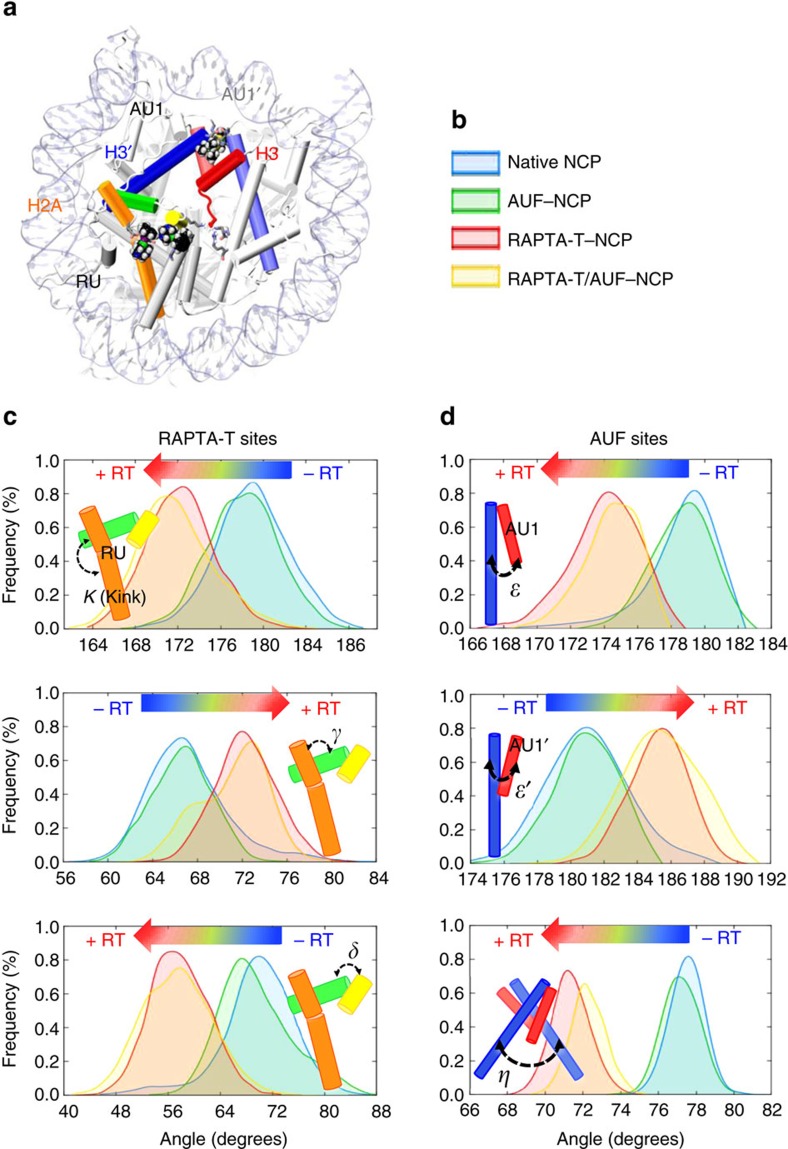
Figure 5. Histone α-helical rearrangements between the RAPTA-T and AUF adduct sites.
(a) Highlighting of dynamically coupled α-helices. (b) Colouring scheme for the different NCP systems shown in the probability distributions of panels c and d. (c,d) Probability distribution functions of the angles between the H2A (orange, green and yellow) and H3/H3′ (red, blue) α-helices that mediate an interface linking the RAPTA-T sites (c) and the AUF sites (d), calculated over the equilibrium trajectories of the native NCP (blue), AUF–NCP (green), RAPTA-T–NCP (red) and RAPTA-T/AUF–NCP (yellow) systems. A shift in the probability distributions is observed when RAPTA-T adducts are present (+RT) and is indicated with a blue-to-red arrow (−RT, adducts absent). A cartoon representation of the calculated inter-helix angles is shown within each graph, color-coded as given in the structure of the NCP in a.

