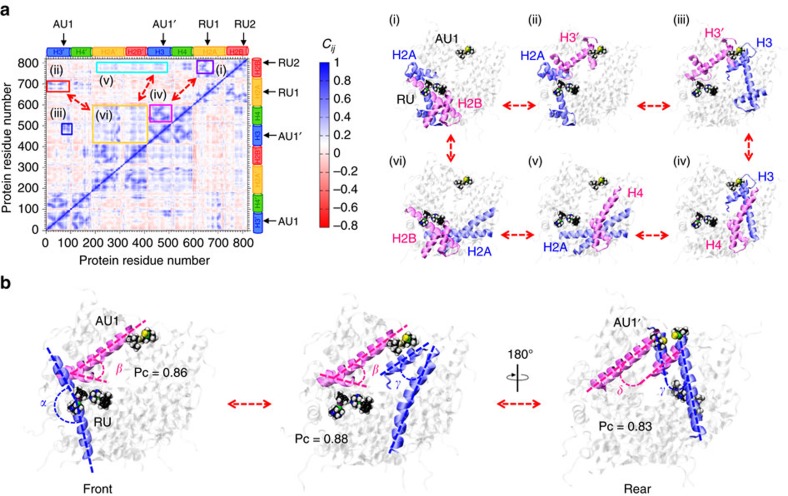
Figure 6. Allosteric mechanism mediating cross-talk between RAPTA-T and AUF sites.
(a) Cross-correlation matrix of the fluctuations of the Cα atoms (Cij) around their mean positions, calculated over the equilibrium MD trajectory of the RAPTA-T/AUF–NCP system. The extent of correlated (0>Cij<1) and anticorrelated (−1>Cij<0) motions is color-coded according to the scale on the right. RAPTA-T (RU1/RU2) and AUF (AU1/AU1′) sites are indicated, as well as the H2A, H2B, H3 and H4 histones. Highly correlated regions are highlighted within the panels (i–vi). Histone protein components involved in the (i–vi) correlations are shown on the right. Histones are shown in cartoon representation, with correlated residues highlighted in blue and magenta. RAPTA-T and AUF are in space-filling representation. (b) Graphical representation of Pearson correlation coefficient (Pc) analysis used to compute the strength of coupling between the dynamics of the α-helices of the histones for the RAPTA-T/AUF–NCP system. The highest Pc calculated between pairs of angles formed by the adjacent histone α-helices are reported, revealing a correlation path that connects the H2A α-helix kink, occurring at the RU sites, with the AUF sites at both the front (AU1) and rear (AU1′) of the nucleosome. Blue and magenta dashed lines are used to indicate the correlated angles. The structure is rotated along the pseudo-twofold axis, showing the front face (left and middle) and rear face (right) of the NCP.

