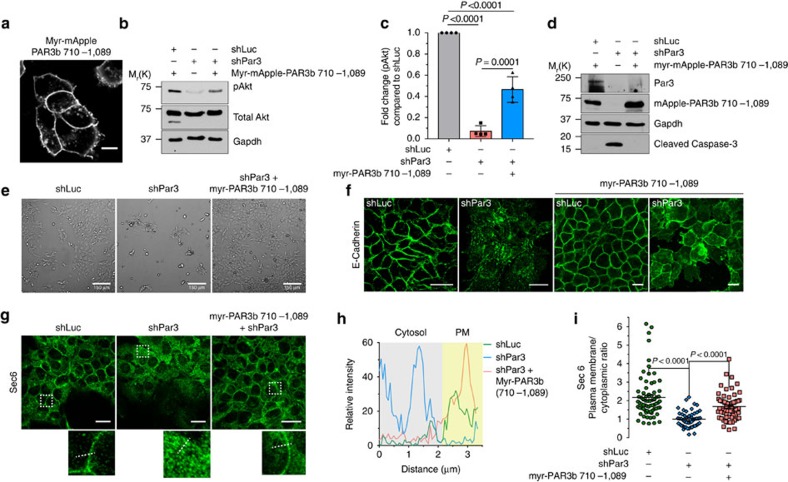
Figure 8. Par3-exocyst binding is sufficient for cell survival and E-cadherin localization.
(a) Confocal image showing localization of myr-mApple-PAR3(710-1089); scale bar, 10 μm. (b) pAkt levels in NMuMG cells expressing shLuc, shPar3 or shPar3+myr-mApple-PAR3(710-1089). Gapdh and Total Akt used as protein-loading controls. (c) Quantification of experiments shown in b from three independent experiments, mean±s.d. P values were calculated using one-way ANOVA followed by Dunnett's multiple comparison tests. (d) Western blot analysis of cleaved caspase-3 in NMuMG cells expressing shLuc, shPar3 or shPar3 with myr-mApple-PAR3(710-1089). (e) DIC images of NMuMG cells expressing shLuc, shPar3 or shPar3 with myr-PAR3b (710-1089); scale bar, 150 μm. (f) Confocal images showing E-cadherin localization in NMuMG cells expressing shLuc, shPar3 alone or with myr-mApple-PAR3(710-1089); scale bars, 20 μm. (g) Confocal images showing Sec6 localization in NMuMG cells expressing shLuc, shPar3 or shPar3 with myr-mApple-PAR3(710-1089). White boxes represent cropped images shown below; scale bars, 20 μm. (h) Intensity plot corresponding to the white lines in the cropped images in g. Cytoplasmic portion shaded in grey and approximate PM portion shaded in yellow. (i) Quantification of the PM to cytoplasmic ratio of Sec6 localization from three independent experiments; Graph shows mean±s.e.m., P values assessed using one-way ANOVA followed by Kruskal–Wallis multiple comparison tests. ANOVA, analysis of variance.

