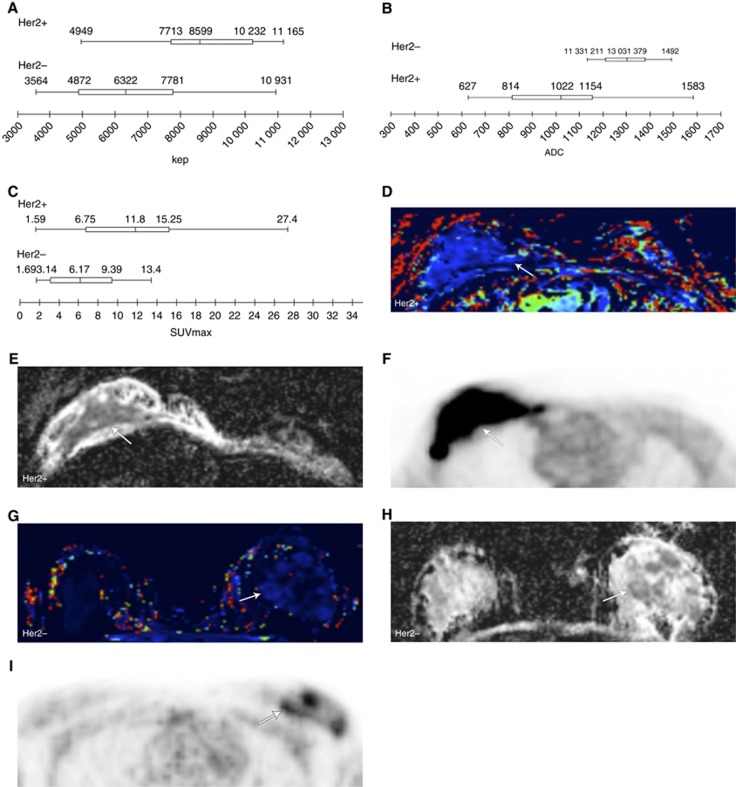
Figure 2.
Her2 and PET/MR biomarkers. Diagram demonstrating correlation between Her2 expression and Kep(A); diagram showing correlation between Her2 expression and ADC (B); diagram displaying correlation between Her2 expression and SUVmax (C). Her2+ cancer (D–F). A Kep parametric map (D) is shown with a corresponding ADC map (E) and axial PET (F). The Her2+ cancer (arrow) demonstrates high Kep values (light blue) (D), low ADC values (dark grey) (E), and high FDG uptake (F). Her2− cancer (G–I). A Kep parametric map (G) is shown with a corresponding ADC map (H) and axial PET (I). Her2− cancer displays low Kep values (dark blue) (G), high ADC values (light gray) (F), and low FDG uptake (I).

