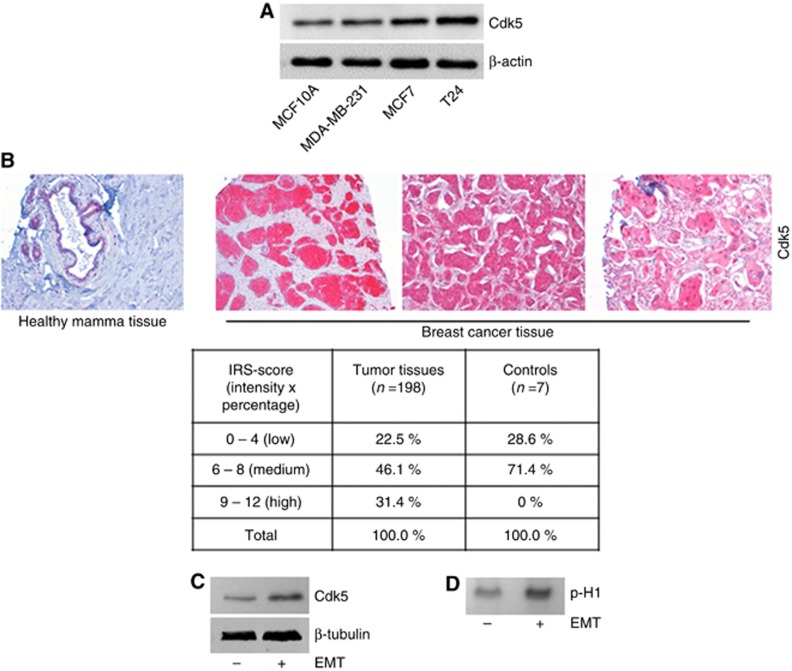
Figure 1.
Expression of Cdk5 in human cell lines and cancer tissue.(A) The immunoblots show levels of Cdk5 in breast epithelial cells MCF10A, and cancer cell lines MDA-MB-231, MCF7 and T24. Actin indicates equal loading (n=3). (B) Representative immunostainings from a human breast cancer TMA show Cdk5 expression in healthy mamma tissue and breast cancer tissues. The table displays the evaluation of Cdk5 expression in tumour tissues (n=198) and healthy tissues (controls, n=7) according to the IRS score (intensity × positivity). (C) Immunoblots show Cdk5 expression in HMLE cells that have (+) or have not (−) undergone EMT. Tubulin indicates equal loading (n=3). (D) Cdk5 activity in HMLE cells that have (+) or have not (−) undergone EMT is shown by phosphorylated histone H1 (p-H1; n=3).

