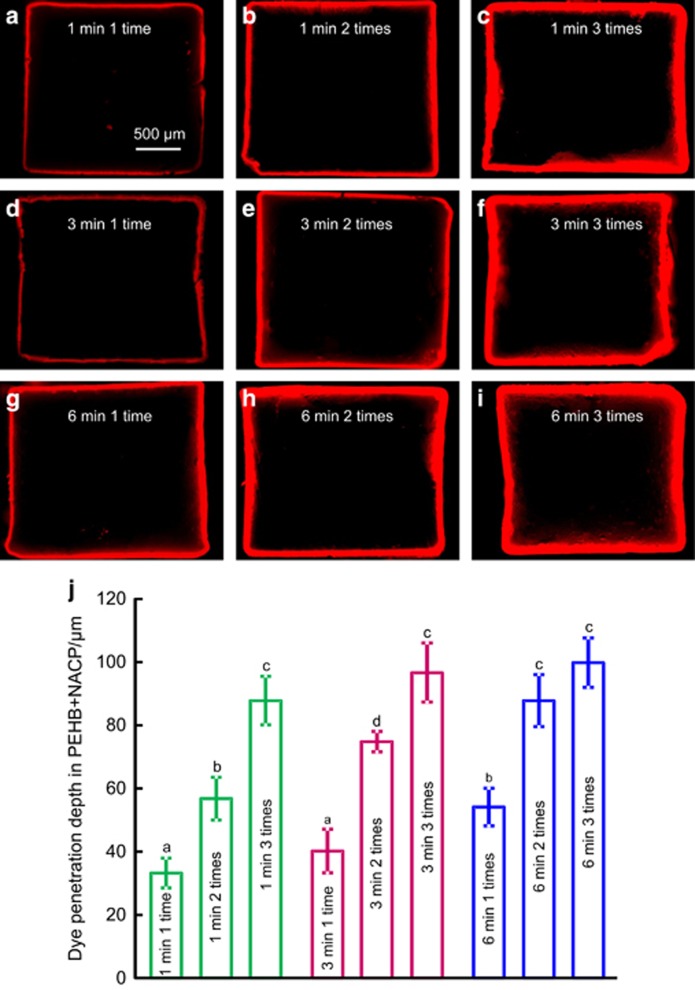
Figure 4.
Typical images of rhodamine B fluorescent dye penetration for different recharge groups. (a) 1 min 1 time; (b) 1 min 2 times; (c) 1 min 3 times; (d) 3 min 1 time; (e) 3 min 2 times; (f) 3 min 3 times; (g) 6 min 1 time; (h) 6 min 2 times and (i) 6 min 3 times. The image shows the cross-section of the bar of ~2 mm × 2 mm. The red area indicates the depth of penetration. (j) Quantitative measurement of the dye penetration depth (mean±standard deviation, n=6). Dissimilar letters indicate values that differ from each other (P<0.05). NACP, nanoparticles of amorphous calcium phosphate.

