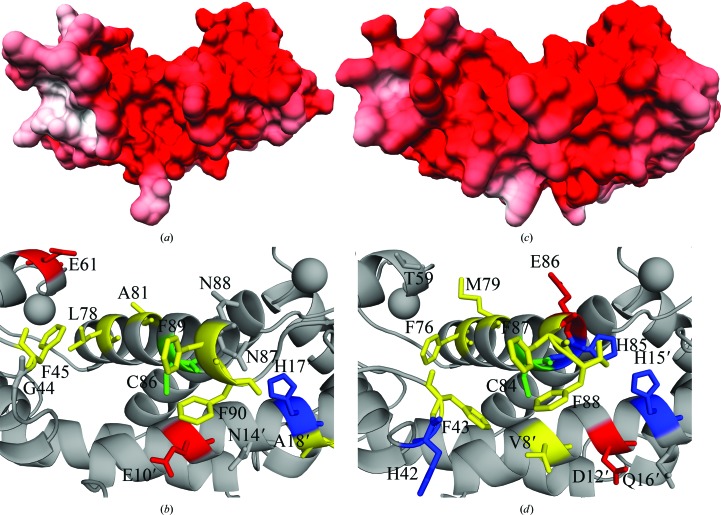
Figure 2.
Left: electrostatic surface model (a) and ribbon diagram (b) of the Ca2+-S100A1 crystal structure, highlighting the binding pocket. Right: electrostatic surface model (c) and ribbon diagram (d) of the Ca2+-S100B crystal structure (PDB entry 1mho; Matsumura et al., 1998 ▸). In the ribbon diagrams, hydrophobic residues are in yellow, positively charged residues are in blue and negatively charged residues are in red. Key residues are labeled; see text for additional details. Electrostatic surface models were generated using PDB2PQR (Dolinsky et al., 2004 ▸, 2007 ▸), APBS (Czodrowski et al., 2006 ▸) and UCSF Chimera (Pettersen et al., 2004 ▸).

