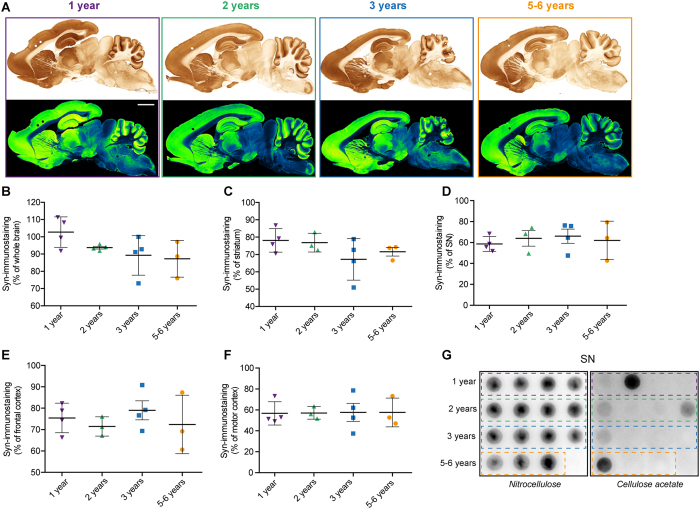
Figure 2. Distribution of α-synuclein in wild-type Octodon degus brains.
(A) Sagittal brain section of octodons at different ages showing distribution of α-synuclein (α-syn) immunoreactive PD-related regions. In the lower panel, Green fire blue LUT (lookup table) was applied to scanned section to enhance contrast and highlight the absence of difference between groups. (B–F) Surface quantification of the α-syn immunostaining in whole brain (B), at striatal (C) and mesencephalic (D) levels as well as in the frontal (E) and motor cortex (F) of octodons. (G) Midbrain protein extracts were analyzed by filter retardation assay either on nitrocellulose membrane (left) or cellulose acetate membrane (right) and revealed by immunoblot with α-syn antibody. Scale bar: 3 mm.

